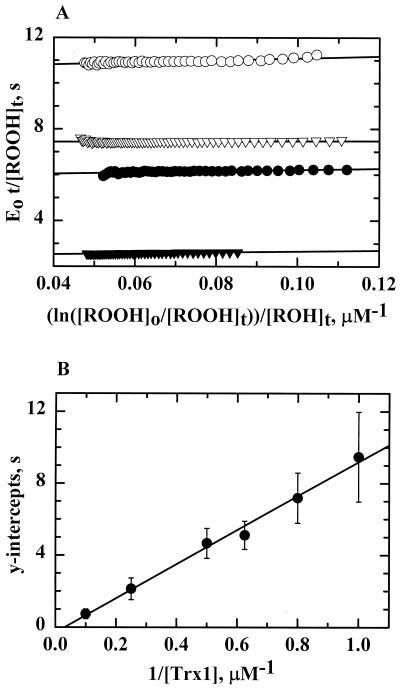
FIG. 7.
Kinetic analysis of AhpC from H. pylori by the Dalziel method. Assays of AhpC were conducted on a stopped-flow spectrophotometer using AhpC (4.0 μM), Trx1 (2.0 μM), and E. coli TrxR (1.0 μM) with NADPH (150 μM) and limiting amounts of peroxide (10 to 40 μM). Proteins were incubated with NADPH for 5 min prior to mixing with peroxide. The resulting reaction traces were used to calculate [ROOH] and [ROH] over time. (A) In the Dalziel primary plot, a least-squares linear regression line was obtained for the calculated data points for five different concentrations of Trx1: 4.0 μM (closed triangles), 2.0 μM (closed circles), 1.6 μM (open triangles), and 1.0 μM (open circles). The resulting lines give slopes of φ1 and intercepts of φ2/[Trx1]. (B) The apparent maximum velocities (y intercepts from the primary plot) were replotted in a Dalziel secondary plot against the reciprocal of the [Trx1] at which they were obtained. The slope of the resulting linear regression line is φ2.

