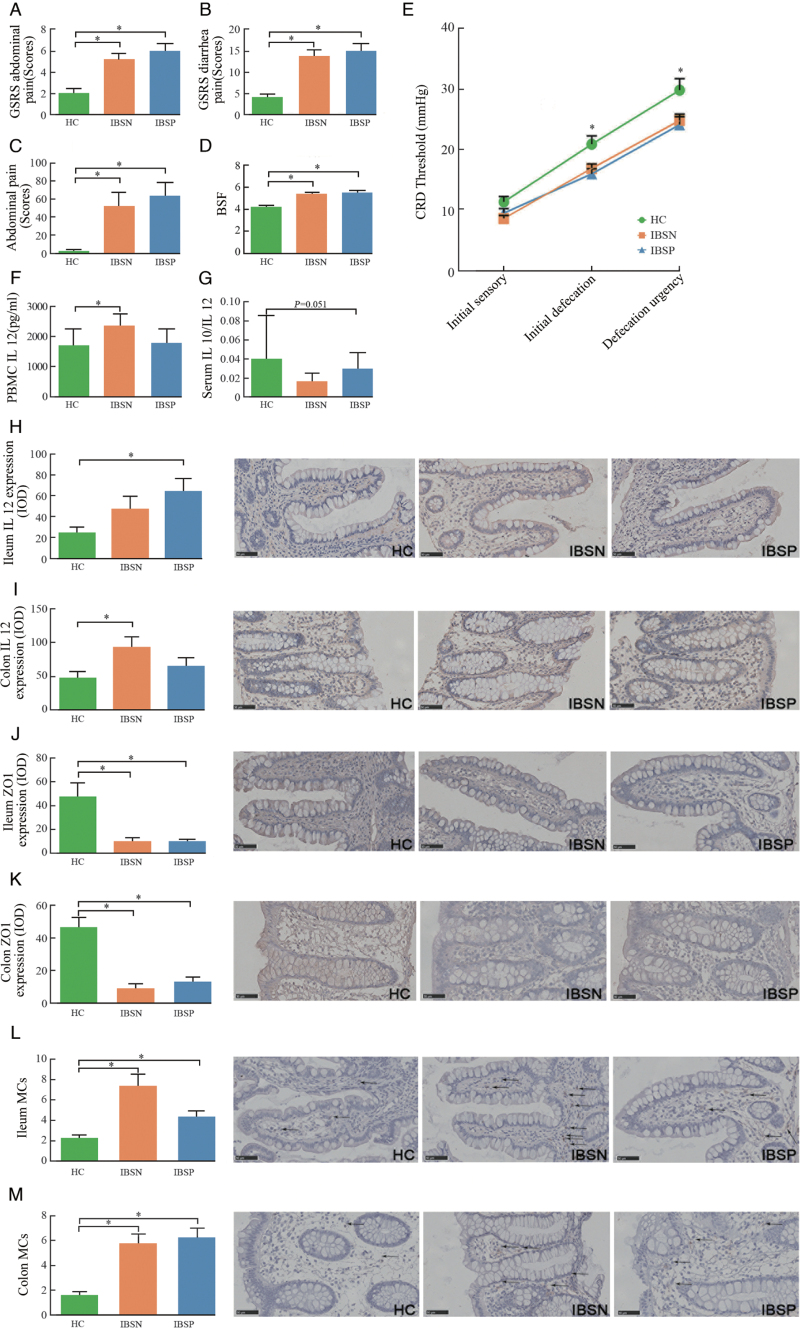
Figure 1.
Clinical symptom evaluations and inflammation factors among the three groups. (A,B) Abdominal pain and diarrhea scores evaluated by GSRS; (C) Abdominal pain score evaluated by IBS-SSS; (D) BSF scores; (E) CRD test; ∗IBSN vs. HC, Mann-Whitney U test, P < 0.05; (F) IL12 in PBMCs culturing supernatant; (G) Ratio of IL10/IL12 in serum; (H,I) IL12 expression in ileum and colon; (J,K) ZO1 expression in ileum and colon; (L,M) MCs counts in ileum and colon, shows by arrows. ∗IBSP or IBSN vs. HC, Mann-Whitney U test, P < 0.05. GSRS: Gastrointestinal Symptom Rating Scale; IBS-SSS: IBS Symptom Severity Scores; BSF: Bristol stool form; CRD: Colon rectal distension; PBMCs: Peripheral blood mononuclear cells; IL10: Interlukin-10; IL12: Interlukin-12; ZO-1: Zona occludens 1; MCs: Mast cells; HC: Healthy control; IBS: irritable bowel syndrome; IBSP: breath test positive IBS patients; IBSN: breath test negative IBS patients; Bars: 50 μm.

