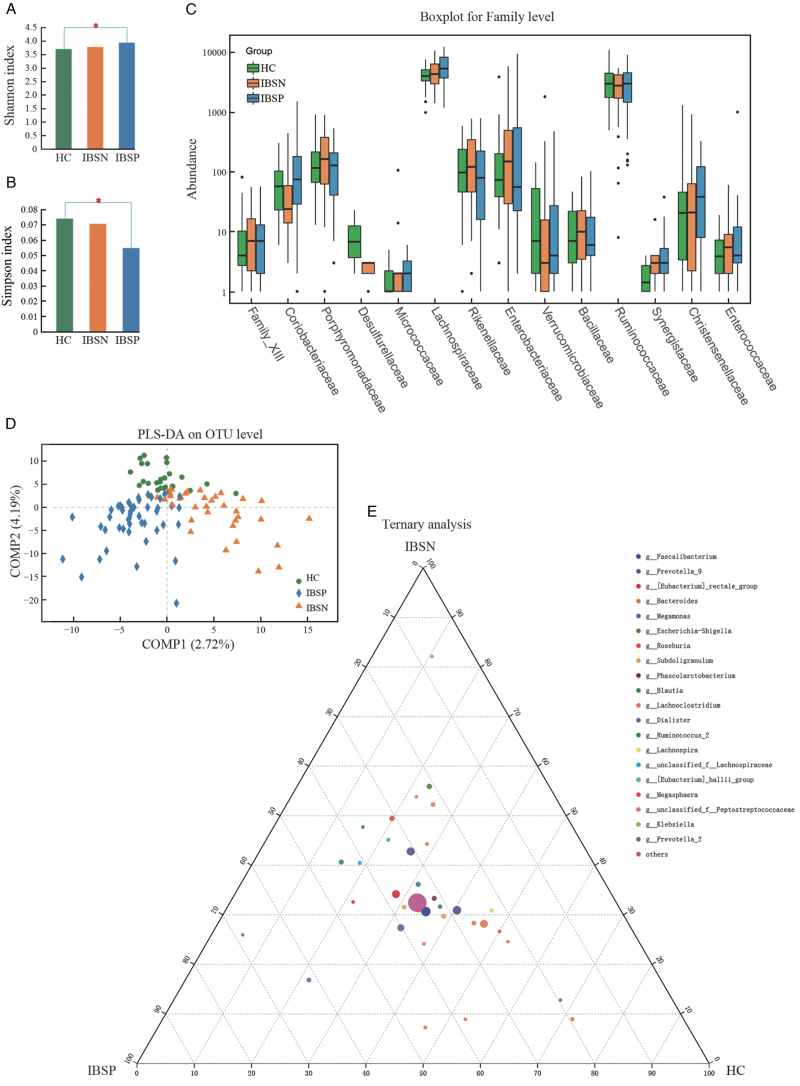
Figure 2.
Different microbiota profiles in IBSN and IBSP. (A) Shannon index analysis, ∗P < 0.05; (B) Simpson index analysis, ∗P < 0.05; (C) Microbial analysis in family level (the family presented are significantly different among the three groups, Kruskal–Wallis test, P < 0.05); (D) PLSDA analysis on OTU level; (E) Ternary analysis in genus level; PLS-DA: Partial least squares discriminant analysis; HC: healthy controls; IBS: irritable bowel syndrome; IBSP: breath test positive IBS patients; IBSN: breath test negative IBS patients.

