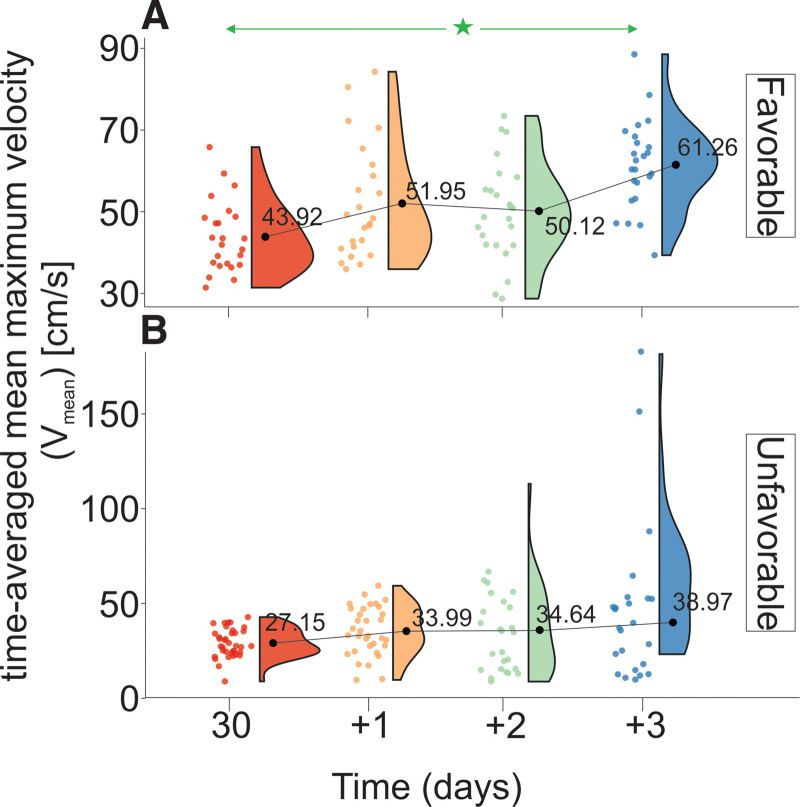
Figure 3.
Changes in Vmean stratified by GOS levels evaluated on discharge from the Department of Neurosurgery. (A) Favorable outcome group and (B) unfavorable outcome group. The vertical size of the cloud refers to 95% CI at a specific time point. The green arrow shows statistically significant differences in the “favorable” outcome group. CI = confidence interval, GOS = Gosling Outcome Scale, Vmean = time-averaged mean maximum velocity. *P < .01.

