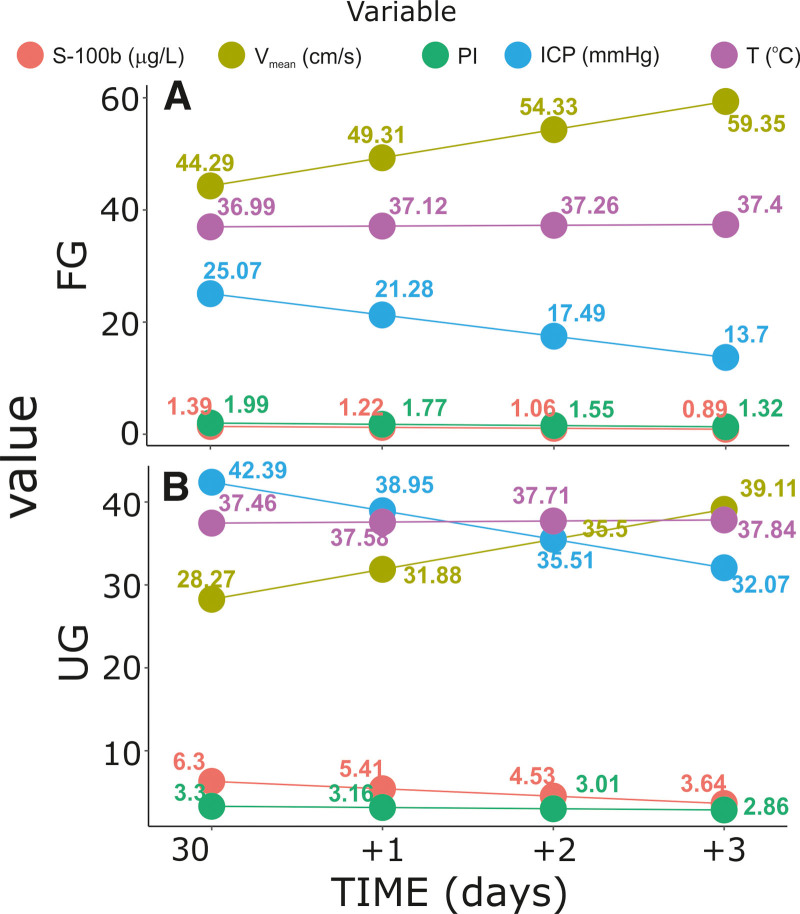
Figure 7.
Relative changes in S100B, Vmean, PI, ICP, and T levels stratified by GOS levels evaluated on discharge from the Department of Neurosurgery. (A) Favorable outcome group and (B) unfavorable outcome group. The number of measurement time points refers to the mean level. The curves are the product of linear regression models. GOS = Gosling Outcome Scale, ICP = intracranial pressure, PI = pulsatility index, T = body temperature, Vmean = time-averaged mean maximum velocity.

