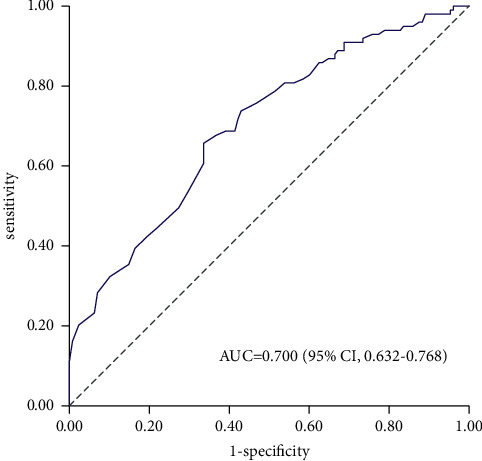
Figure 2.

Receiver operating characteristic curve of the prediction model for predicting intraoperative hypothermia in the overall cohort (N = 227). An AUC of 0.700 (95% CI, 0.632–0.768) was estimated using the Hanley–McNeil nonparametric method. The gray dashed line represents a model no better than chance (AUC = 0.5). AUC indicates the area under the receiver operating characteristic curve; CI, confidence interval.
