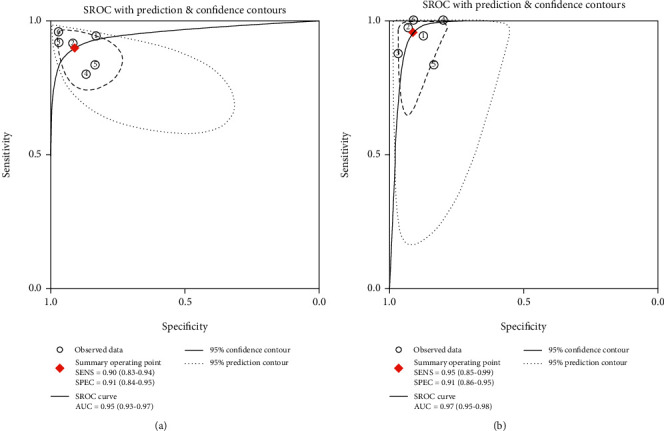
Figure 5.

The SROC curves of TE and 2D-SWE showing performance in staging cirrhosis. (a) SROC plot of TE for fibrosis stage F = 4. (b) SROC plot of 2D-SWE for fibrosis stage F = 4. 2D-SWE: two-dimensional shear wave elastography; SROC: summary receiver operating characteristic; TE: transient elastography. 150 × 75 mm (300 × 300 DPI).
