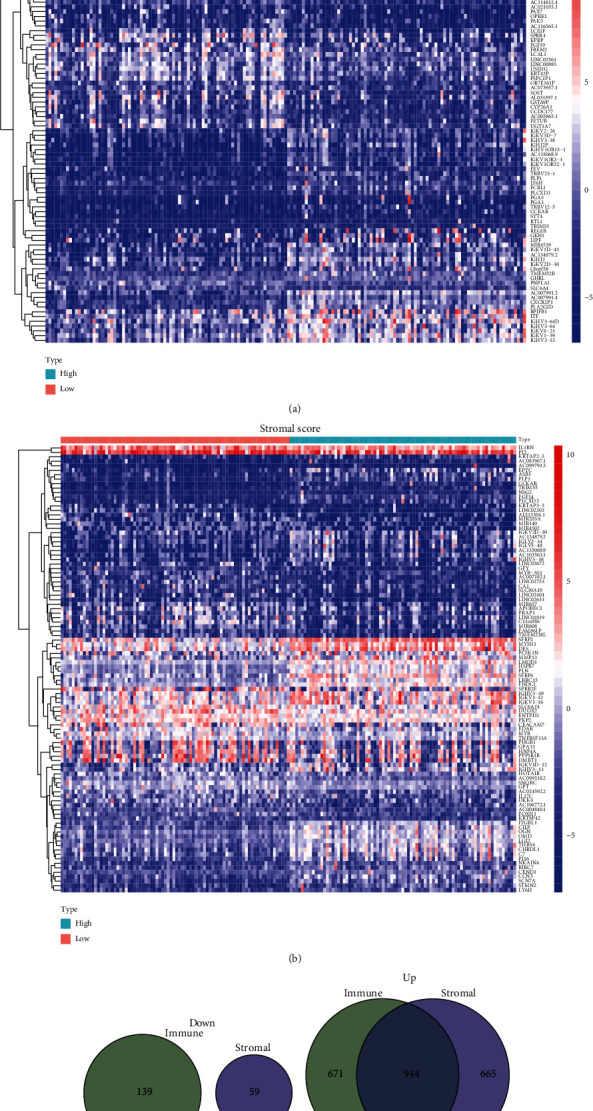
Figure 3.

The discovery of DEGs that are common to both the ImmuneScore and the StromalScore. (a) A heatmap for DEGs that was developed by comparing the group with the high score to the group with the low score using ImmuneScore. (b) Heatmap for DEGs in StromalScore. (c, d) Diagrams in the form of Venn plots illustrating upregulated and downregulated DEGs that are common to both ImmuneScore and StromalScore.
