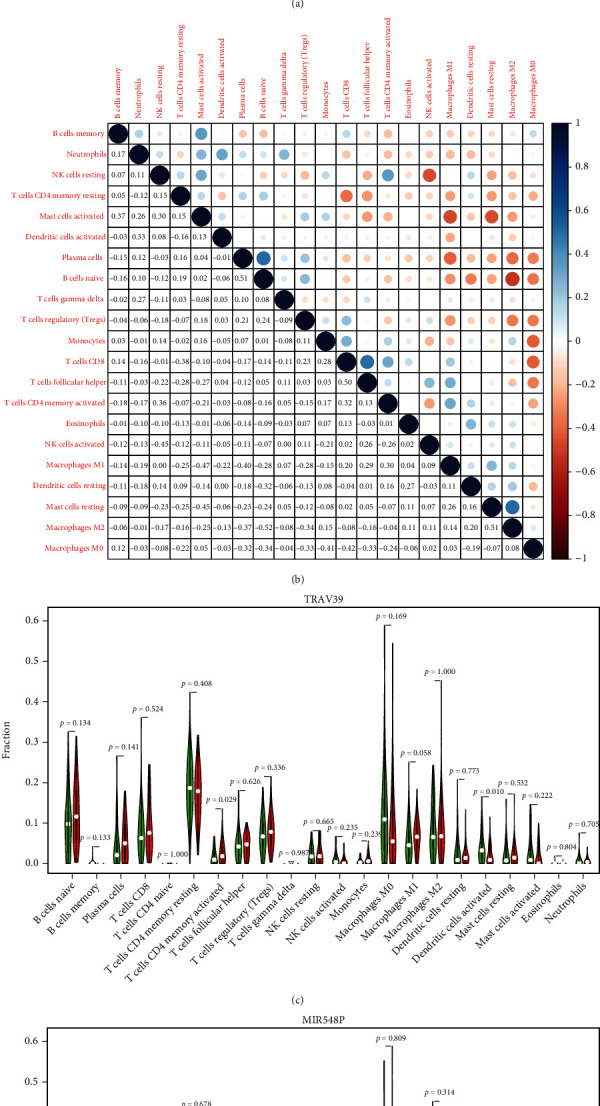
Figure 7.

TIC profile in the tissue samples from the tumors and correlation analysis. (a) The distribution of the 21 different types of TICs found in ESCC tumor samples is shown as a barplot. (b) A heatmap displaying the correlation between 21 different types of TICs, with a number in each little box reflecting the p value of correlation between two different types of cells. (c, d) All ESCC cases were divided into the high and low (c) MIR548P and (d) TRAV39 expression groups, based on the median of MIR548P and TRAV39 expressions, and the Wilcoxon rank-sum test was carried out.
