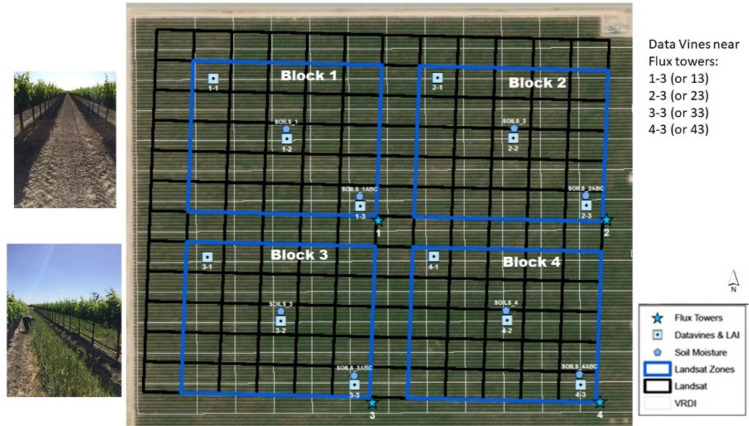
Fig. 2.
The RIP720 experimental set-up with four blocks, each being sampled continuously by EC towers (blue star points). The white grid is the VRDI system, while the black grid represents the Landsat 30 m resolution pixel coverage over RIP720. Other symbols represent sampling sites for leaf gas exchange, leaf water potential, and leaf area index (blue squares), and profile soil moisture measurements (blue pentagons). In 2019, blocks 1 and 2 had no cover crop in interrow while blocks 3 and 4 had a cover crop present in the interrows

