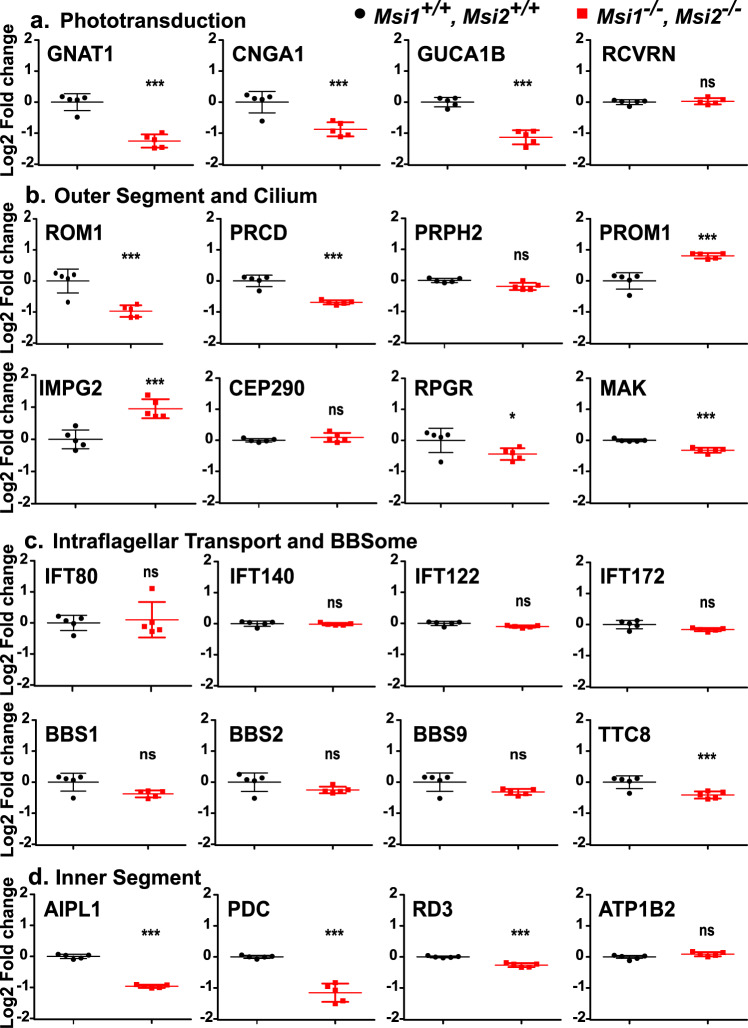
Fig. 7. Expression of proteins critical for photoreceptor function after induced knockout of Msi1 and Msi2 in photoreceptor cells.
Boxplots representing the log2 of the fold change in protein expression relative to the median of the control. Retinal samples were collected 21 days after inducing the knockout at postnatal day 30. Protein levels were determined using isobaric labeling and mass-spectroscopy. Boxplots represent a selected set of proteins that are components of the phototransduction pathway (a), outer segment primary cilium structure (b), intraflagellar transport complex and BBSome (c), and the inner segment (d). The data is represented as mean ± SEM of five replicates. Significance level is indicated as: *adjusted p-value < 0.05, **adjusted p-value < 0.01, ***adjusted p-value < 0.001. Supplementary Data 18 contains the source data underlying the graphs.

