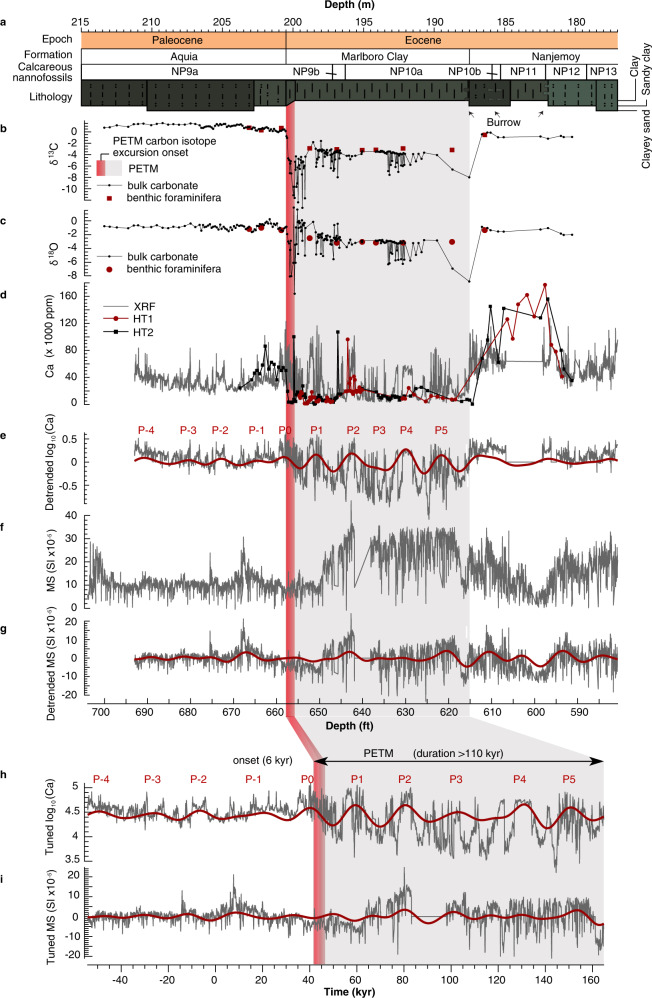
Fig. 2. Time series analyses.
a Chronostratigraphy, lithostratigraphy, calcareous nannofossil zones, and lithology for the Howards Tract (HT) cores. The schematic core log shows the grain size and sediment color of the cores. b δ13C of the HT cores. c δ18O of the HT cores. d Calcium content generated from X-ray fluorescence (XRF) scans of the HT cores correlates well with carbonate content from both Howards Tract 1 (HT1) and Howards Tract 2 (HT2). Ca data from 182–185 m is missing due to a coring gap. e Filtered 2.8 m cycles indicative of precession (P) cycles (red, Gaussian filter with a frequency of 0.35 ± 0.15 m−1) of the detrended log10(Ca) content (gray). f Magnetic susceptibility (MS) of the HT cores. g Filtered 2.8 m cycles indicative of precession cycles (red, Gaussian filter with a frequency of 0.35 ± 0.15 m−1) of the detrended magnetic susceptibility. h, i Tuned log10(Ca) (h) and MS (i) and filtered precession (P) cycles (red, Gaussian filter with a frequency of 0.05 ± 0.018 kyr−1). Pink bar: Paleocene-Eocene Thermal Maximum (PETM) carbon isotope excursion (CIE) onset. Shaded region: PETM.

