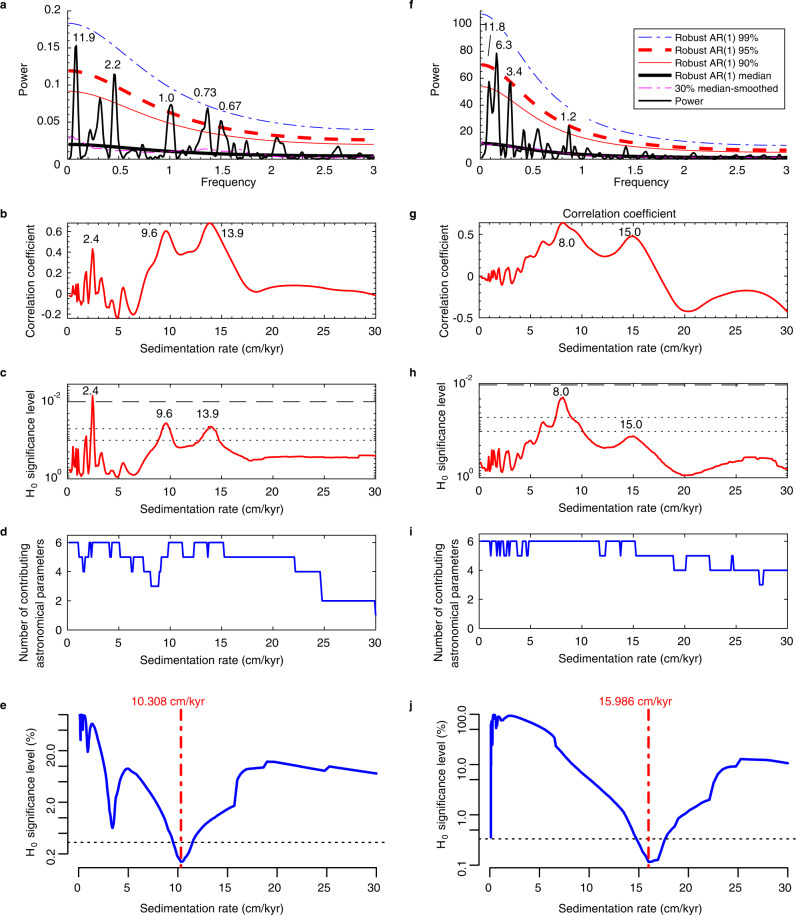
Fig. 4. Spectral analysis and sedimentation rate evaluation of the log10(Ca) (a–e) and magnetic susceptibility (MS) (f–j) series.
a, f Lomb-Scargle spectra of the detrended log10(Ca) (a) and detrended MS (f) series shown with confidence levels test against robust first-order autoregressive AR(1) red noise models. Significant periodicities are labeled with the unit of meters. The 1-slice correlation coefficient (COCO) spectra of the detrended log10(Ca) (b–d) and detrended MS (g–i) series. Correlation coefficient (b, g), null hypothesis (H0) significance level (c, h), and number of contributing astronomical parameters (See Supplementary Information for details) (d, i) are shown. e, j Average spectral misfit (ASM) of the detrended log10(Ca) (e) and detrended MS (j) indicate roughly consistent mean sediment accumulation rate of 10–16 cm/kyr.

