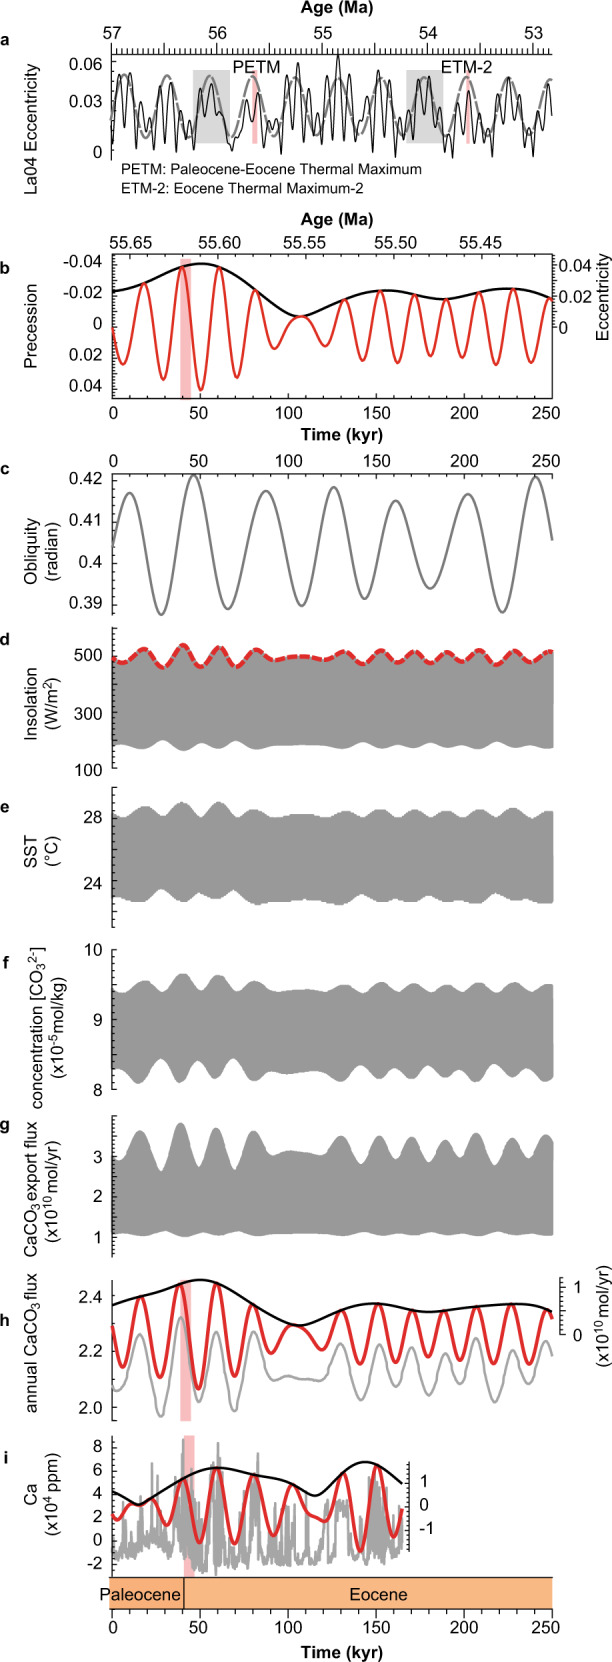
Fig. 6. A model-data comparison of the Ca at Howards Tract.

a Eccentricity of La2004 solution (black)87 and filtered 405 kyr cycles (dashed gray)12. Gray bars in a denote long-term eccentricity minima following12. b Eccentricity (black) and precession (red) models of La2004 solution from 55.66 Ma to 55.41 Ma. c Obliquity model of La2004 solution from 55.66 Ma to 55.41 Ma. d Daily insolation (gray) at Howards Tract (HT) cores. Mean insolation on June 21 (dashed red) is also shown. The sampling rate is 1 kyr. e Daily sea surface temperature (SST) at HT cores. f Daily ocean surface [CO32−] concentration at HT cores. g Daily surface CaCO3 export flux at HT cores. h Annual surface CaCO3 export flux at HT cores (gray) shown with its Taner filtered output (red, cutoff frequency range: 0.032–0.068 kyr−1) and amplitude modulation (black) using Hilbert transform in Acycle. i Tuned Ca content (gray) derived from the HT cores shown with its filtered 20 kyr cycles (red, Taner filter with a cutoff frequency of 0.032–0.068 kyr−1) and amplitude modulation (black). Pink bars denote the Paleocene-Eocene Thermal Maximum carbon isotope excursion (CIE) onset (left bar in a, b, h, and i) and Eocene Thermal Maximum 2 (right bar in a). The frequency of daily time-series sampling is every 964 model time-steps, i.e., 20.083 year. Abbreviations: PETM, Paleocene-Eocene Thermal Maximum; ETM2, Eocene Thermal Maximum 2.
