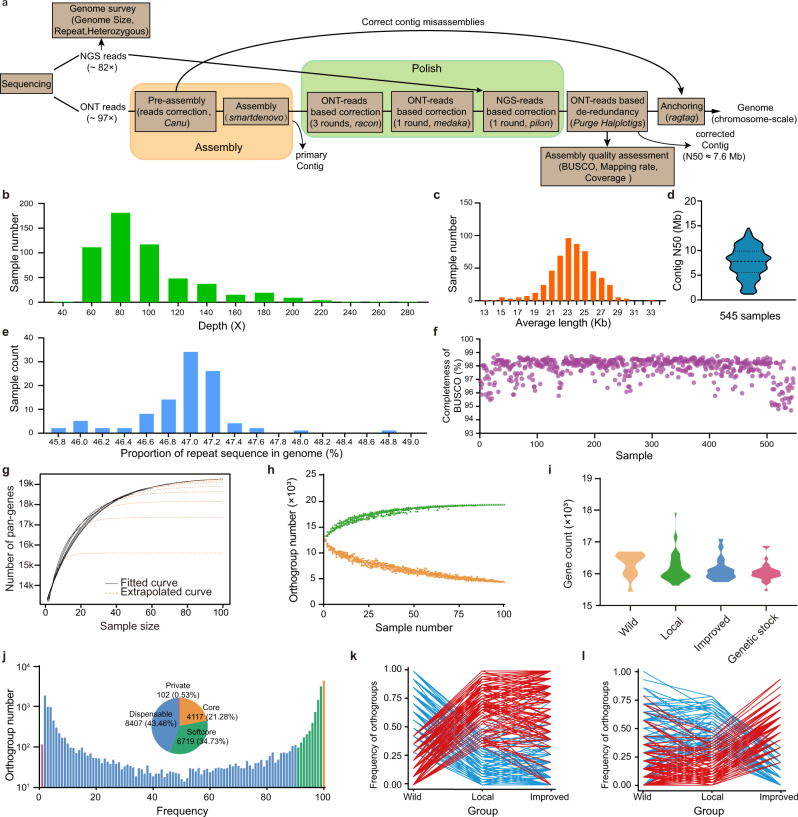
Fig. 3. Sequencing, assembly, and pan-gene analysis of 545 silkworm genomes.
a The strategy of genome sequencing and assembling. b The average long-read coverage distribution among strains. c The average read length distribution among strains. d The distribution of contig N50 length among genomes. e The proportional distribution of repeat sequences. f BUSCO evaluation values. g Evaluation of pan-gene plateau. The black curves are fitted with actual data, and the yellow dotted curves are extrapolated by the model of y = A + BeCx. The pan-genes obtained from 80, 90, and 100 genomes are similar. h Counts of pan-gene (green) and core-gene (orange) with increased samples. i Comparisons of gene counts between wild, local, improved, and genetic stock groups. j Frequency of gene number. The pie chart shows the proportion of core, softcore, dispensable, and private genes in those genomes. k, l genes with significant frequency differentiation between wild-local (k) and local-improved comparisons (l). In the two comparisons, genes with significantly increased (red) or reduced (blue) frequencies either in domestication (k) or improvement (l) are shown with different colors.

