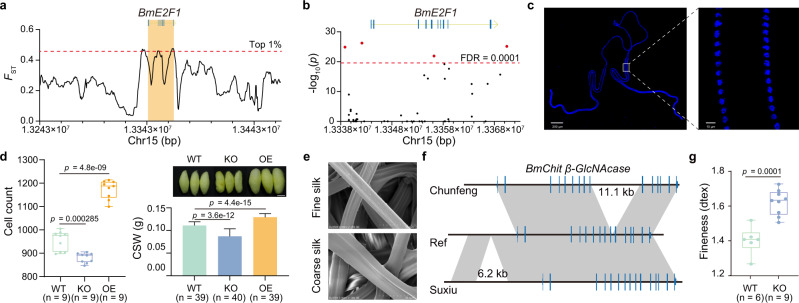
Fig. 6. Genetic basis of silkworm economic traits.
a, b The genomic region of BmE2F1 shows a signature of a positive selection (a) with four SVs (red dots) showing a significant frequency divergence (b) between local and CHN-I silkworms. c Embryonic silk gland nuclei stained with DAPI (blue fluorescence). d Silk gland cell count of BmE2F1 knockout (KO) line, BmE2F1 overexpression (OE) line, and wild type (WT, Dazao) lines (left histogram). Cocoon shell weight (CSW) and cocoons of BmE2F1 KO, BmE2F1 OE, and WT lines (right histogram and picture of cocoons). Data are shown as mean ± SD. Scale bar, 1 cm. Student’s t test (two-tailed). e Silk with fine and coarse denier under a scanning electron microscope. f An 11.1 kb insertion in intron and a 6.2 kb downstream insertion of the BmChit β-GlcNAcase gene in the fineness strains Chunfeng and Suxiu. g CRISPR-cas9 mediated knockout of BmChit β-GlcNAcase produced coarser silk. Student’s t test (two-tailed). In box plots, horizontal lines within boxes indicate the medians, box boundaries indicate the 1st and 3rd quartiles, and whiskers indicate the minima and maxima. Source data are provided as a Source Data file.

