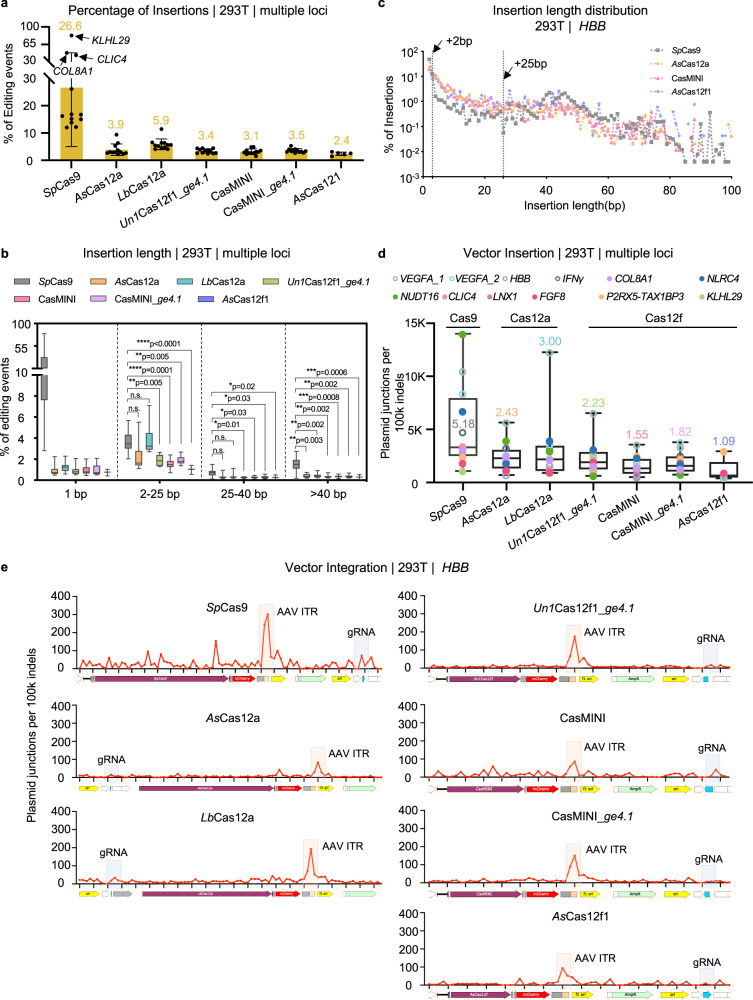
Fig. 4. Cas12f nucleases suppressed vector integration during gene editing.
a Bar chart showing the percentages of insertions for the indicated Cas nucleases as detected by PEM-seq, with the numbers above the bars referring to the average percentages of insertions at all sites for which editing activity was observed (For SpCas9, AsCas12a, LbCas12a, Un1Cas12f1_ge4.1, CasMINI and CasMINI_ge4.1, n = 12; for AsCas12f1, n = 5. Data are presented as mean ± SD). The KLHL29, COL8A1, and CLIC4 loci in the SpCas9 panel are indicated by black arrows. b The distribution of insertions with the indicated length for all tested nucleases at 12 loci in HEK293T cells. Insertions were divided into four lengths: 1 base pair (bp), 2–25 bp, 25–40 bp, and >40 bp, and the vertical axis indicates the number of special insertions to the number of total insertions. Values from minimum to maximum are shown by the whiskers, and the bounds of the box indicate the first and third quartile (N = 12, for AsCas12f1, n = 5). The vertical line through the box is the median. In 2–25 bp, 25–40 bp, and >40 bp insertions, One-way ANOVA with Geisser-Greenhouse correction analysis was performed for all seven data sets: SpCas9, AsCas12a, LbCas12a, Un1Cas12f1_ge4.1, CasMINI, CasMINI_ge4.1, and AsCas12f1. n.s. not significant, *p ≤ 0.1, **p ≤ 0.01, ***p ≤ 0.001, ****p ≤ 0.0001. c The insertion length distribution with the indicated length at the HBB locus in HEK293T cells. Total insertion junctions are plotted on the log scale. The different colors indicate different Cas nucleases. Black arrows mark 2-bp insertions and 25-bp insertions. d Statistical analysis of vector integration junction numbers per 100k on-target indels for different Cas nucleases at each of the 12 loci, as detected by PEM-seq cloning from the on-target region, with the numbers above the whiskers or within the boxes referring to the average percentages of vector integration numbers at all sites. K means thousand. Values from minimum to maximum are shown by the whiskers, and the bounds of the box indicate the first and third quartile (N = 12, for AsCas12f1, n = 5). The vertical line through the box is the median. Source data are provided as a Source Data file. e The distribution of vector cleavage and integration junctions across the respective plasmids for every 100k indels for the different Cas nucleases at the HBB locus as detected by PEM-seq. K means thousand. Bin size = 100 bp. The adeno-associated virus (AAV) inverted repeat (ITR) region and the guide (g) RNA scaffold are highlighted with pale-yellow and light blue shadows, respectively.

