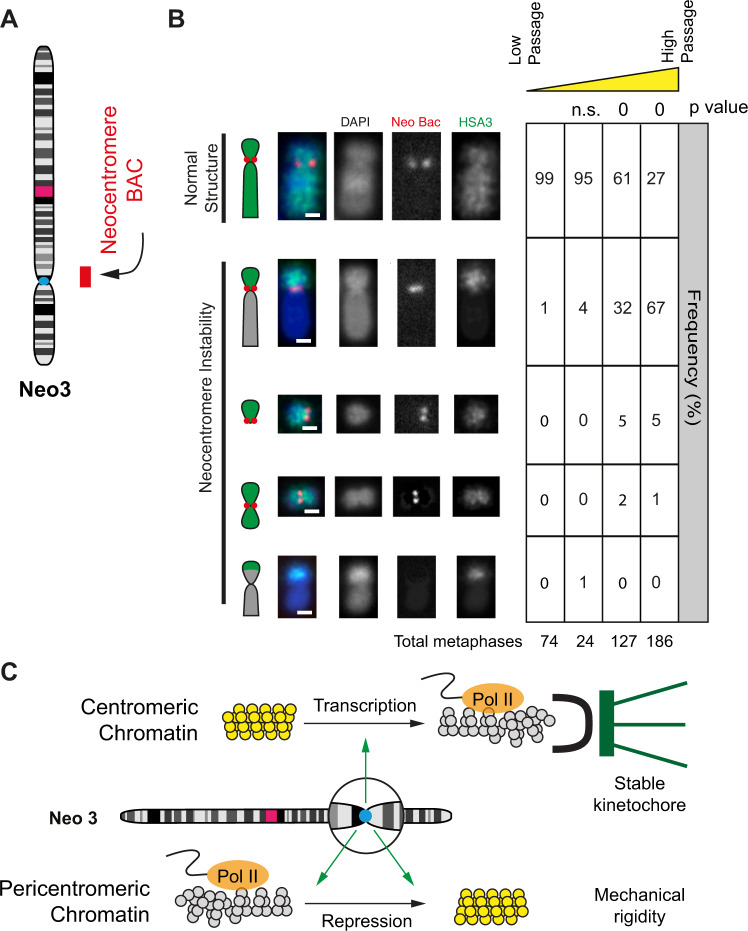
Fig. 7. Neocentromere chromosome instability.
A Neo3 ideogram and BAC probe used to analyse chromosome stability. B Left, representative 2D DNA FISH images of Neo3 metaphase chromosomes hybridised to a human chromosome 3 paint (green) and BAC (red) located at the neocentromere. Chromosome morphology was scored as normal or showing instability: deletions, fusions or duplications. The bar is 2 μm. Right, quantification (%) of different chromosome morphologies with increasing passage number (low ~10, high >50) over time. P values are for a χ2 test compared to low passage. C Model showing transcription-dependent centromere remodelling to a disrupted euchromatin state (grey) and pericentromeric chromatin repression to form heterochromatin (yellow). We suggest that disrupted euchromatin provides a suitable foundation for a high-fidelity kinetochore whilst heterochromatin and the accumulation of satellite sequences generate surrounding mechanical rigidity.

