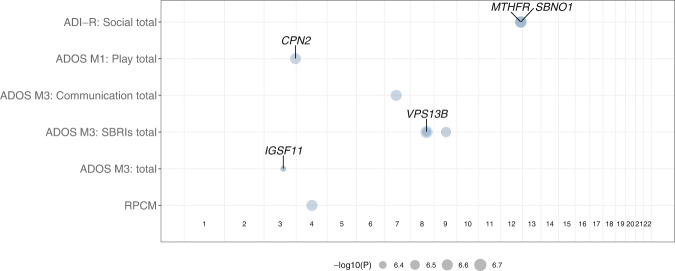
Fig. 2. Overview of genomic loci associated with endophenotypic scores.
Genome-wide association analysis with each of endophenotype scores highlights significant loci and genes. Horizontal axis indicates genomic position from chromosome 1 to chromosome 22 and each row in vertical axis is organized by test instruments and phenotypic scores. The phenotype scores with significantly associated loci are (top to bottom): Social score from ADI-R, Play score from ADOS Module 1, 3 scores from ADOS Module 3 (Communication, Stereotyped Behaviors and Restricted Interests, and Total scores) and RPCM Total score. Circles indicate genomic loci with p < 5 × 10⁻⁷, where the bigger the size the smaller the nominal p-value as indicated in the legend below x-axis. The genes that overlap with or in 250 kbps flanking region of each significant genomic loci are displayed next to the corresponding circles and significant loci in intergenic regions are displayed without an associated gene symbol.

