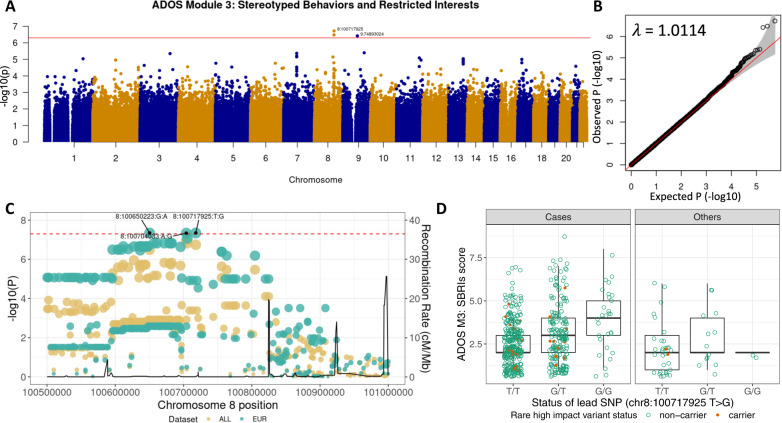
Fig. 3. Association between ADOS Module 3 stereotyped behaviors and restricted interests total score and variants in the VPS13B gene.
A The Manhattan plot of the quantitative locus analysis (QTL) results. The top-significant variants with p < 5 × 10⁻⁷ in each chromosome are labeled by their genomic loci as chromosome:base-position. The horizontal line represents the threshold of p = 5 × 10⁻⁷. The y-axis represents p-value in -log10 scale for genome-wide association test with SBRIs score based on linear mixed model using BOLT-LMM software. B A quantile-quantile plot and the genomic inflation factor (λgc) estimated for genome-wide association analysis (GWAS) with ADOS Module 3 Stereotyped Behaviors and Restricted Interests score. No significant inflation is found for the association test statistics (λgc = 1.0114). C Regional plot showing a significant quantitative trait locus around the VPS13B gene (located in chromosome 8:100025494–100889814). The horizontal dotted line represents the genome-wide significance level (p = 5 × 10⁻⁸). Each dot represents variant tested for association with its size proportional with its -log10(p-value). The yellow dots show results using all available individuals (N = 600), while the green dots with European individuals only (N = 440). The line graph shows the recombination rates (cM/Mb). D Distribution of SBRIs scores by the status of lead variant (8:100717925 T > G, or rs2510202) in the VPS13B gene. Individuals carrying variant allele (G-allele) show higher SBRIs score in ADOS Module 3. Also, individuals with rare and high impact variants in the VPS13B gene (brown filled dots) do not present extreme SBRIs scores than non-carriers (green circle).

