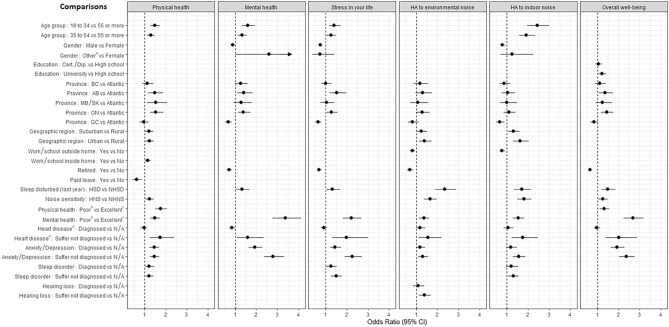
Figure 3.
Multivariate logistic regression model as determined by stepwise regression. For each COVID-19 outcome the probability of “Somewhat/much worse” is modelled against “unchanged, somewhat/much improved”. Odds ratio (95% confidence interval CI) is always compared to the reference category as specified in the comparison list. Odds ratios (95% CI) presented are for the variables that remained in the final multivariate logistic regression model. Income, Indigenous status, Unemployed or Other work status did not enter any of the final multivariate logistic regression models. Confidence intervals that do not include 1 indicate a statistical significance of p < 0.05. For the outcome “Mental health”, when comparing genders “Other vs Females” the upper 95% confidence limit was equal to 6.73. It was suppressed here in order to better read the confidence intervals of the other odds ratios. aIncludes “Other and prefer not to say”; bIncludes “Poor and fair”; cIncludes “Excellent, Good, and Very good”; dIncluding high blood pressure. AB Alberta, BC British Columbia, HA highly annoyed, HBP high blood pressure, HNS highly noise sensitive, HSD highly sleep disturbed, NHNS not highly noise sensitive, NHSD not highly sleep disturbed, MB Manitoba, ON Ontario, QC Quebec, SK Saskatchewan. HSD and HNS included responses 8, 9 or 10 on the 11-point numeric scale where 0 was equivalent to not at all sleep disturbed/noise sensitive and 10 was equivalent to extremely sleep disturbed/sensitive to noise. The NHSD or NHNS included responses 0–7. Atlantic provinces include New Brunswick, Newfoundland and Labrador, Nova Scotia, and Prince Edward Island.

