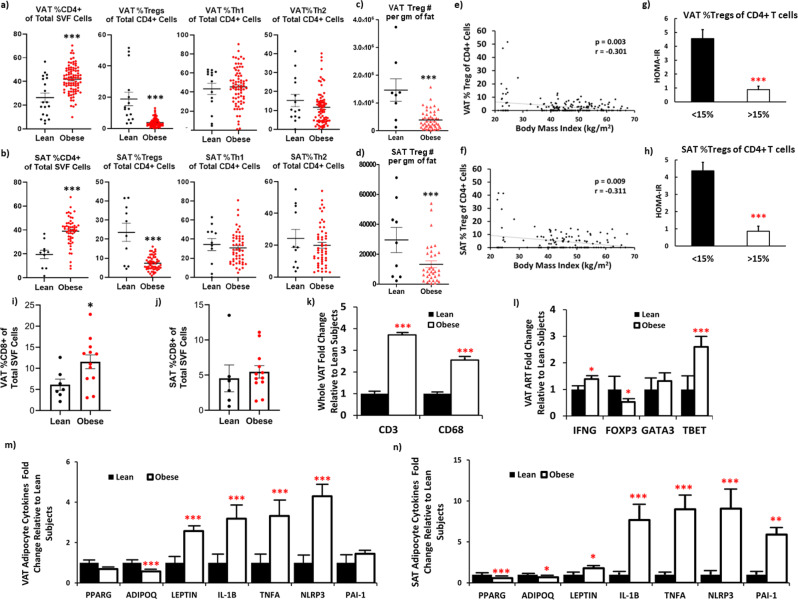
Fig. 1. Decreased Treg abundance in adipose tissue (AT) obtained from obese vs. lean subjects associates with insulin resistance.
Adipose regulatory T (Treg), Type 1 (Th1), and Type 2 (Th2) helper T lymphocytes as percent of total CD4 + cells in (a) visceral (VAT) (N = 15 lean independent subjects and N = 83 obese independent subjects) and (b) subcutaneous (SAT) (N = 11 lean independent subjects and N = 52 obese independent subjects) AT of individuals analyzed by two-sided T-test. AT Tregs per gram of fat tissue in (c) VAT (N = 50 obese and N = 9 lean independent subjects) and (d) SAT (N = 34 obese and N = 9 lean independent subjects). Correlation analyses (Spearman) between %Treg and body mass index (BMI) in (e) VAT and (f) SAT. Insulin resistance (HOMA-IR) in patients with %Tregs less than (N = 73 biologically independent subjects) or greater than 15% (N = 5) of total CD4 + T cells in (g) VAT and (h) SAT, analyzed by two-sided T-test. Patients on diabetes medications were excluded from analyses. CD8 + Tcells as a % of SVF in (i) VAT (N = 7 lean and N = 12 obese subjects) and (j) SAT (N = 6 lean and N = 12 obese subjects). (k) Whole VAT, (l) VAT adipose resident T (ART) cells, (m) VAT and (n) SAT adipocyte gene expression in lean (black bars) and obese (white bars) subjects by two-sided T-test. All means for lean subject gene expression are presented as normalized to 1. Abbreviations: Leptin (LEP), Interleukin (IL)−1B, tumor necrosis factor alpha (TNF), NOD-, LRR- and pyrin domain-containing protein 3 (NLRP3), plasminogen activator inhibitor-1 (PAI-1 or SERPINE1), adiponectin (ADIPOQ), and peroxisome proliferator-activated receptor gamma (PPARG). Source data are provided as a Source Data file. Data presented as mean ± SEM. ***p < 0.001; **p < 0.01; *p < 0.05; and ╤p < 0.20. No replicate samples were utilized.

