
FIGURE 3.
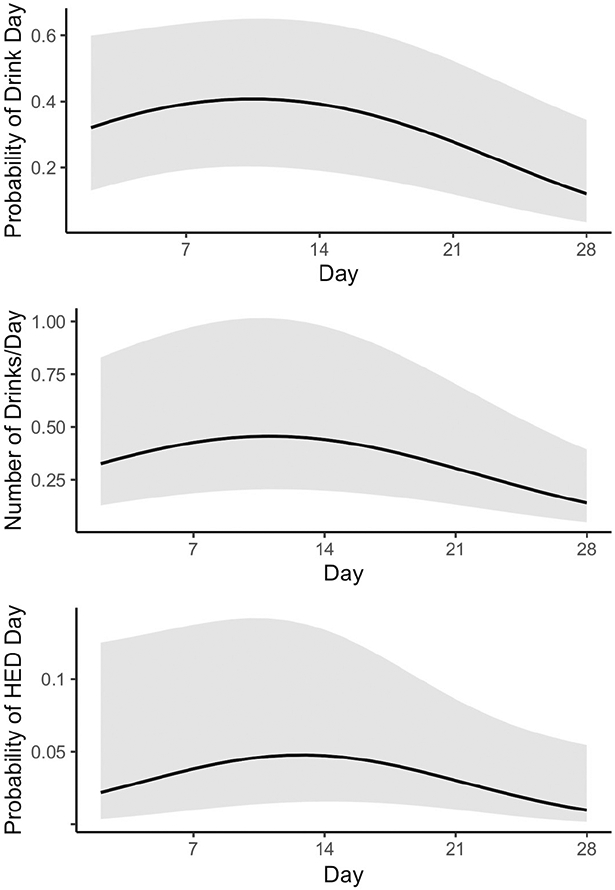
Model-implied trajectories of alcohol outcomes. The top panel plots the probability of drinking on a given day. The mid panel plots the number of drinks per day. The bottom panel plots the probability of heavy episodic drinking on a given day.