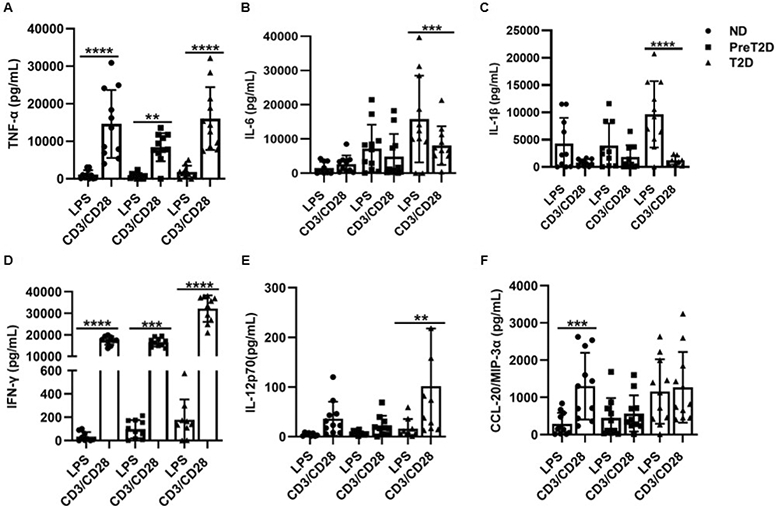
Fig. 4: T cell stimulation elicits more TNF-α than myeloid stimulation of PBMCs from all obese subjects.

Direct comparison of cytokines elicited by 20 hr. stimulation of PBMCs from ND (circles), prediabetes (squares) or diabetes (triangles) subjects as indicated. Differences identified by a mixed effects analysis are indicated. Bars show average and SD with Ns shown in Table S1.
