
Fig. 5: Intracellular staining confirms the CD4+ T cells population produces more TNF-α than myeloid cells.
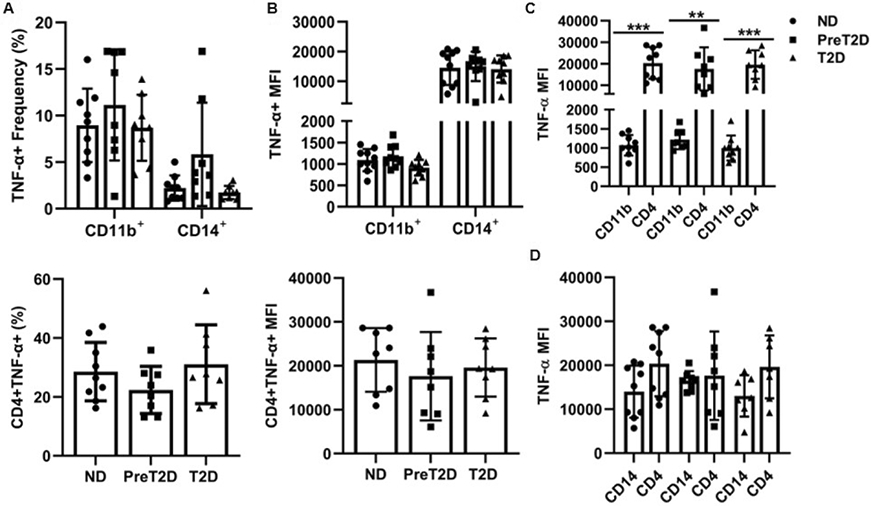
(A) Frequency of (top) CD11b+ myeloid cells and CD14+ monocytes or (bottom) CD4+ T cells from ND (circles), prediabetes (squares) or diabetes (triangles) PBMCs that stained positive for TNF-α. Frequency was relative to total PBMCs. (B) Mean fluorescence intensity (MFI) indicates the average number of TNF-α molecules produced on a per cell basis in the cell types indicated. A direct comparison of intracellular TNF-α as measured by MFI in CD4+ T cells versus (C) CD11b+ myeloid cells or (D) CD14+ monocytes. Frequencies in panel A x MFI in panel B approximate the contribution of each cell type to total TNF-α production. Differences were identified by one-way ANOVA or multiple-effects analysis with Tukey’s multiple comparisons. N=11/group.