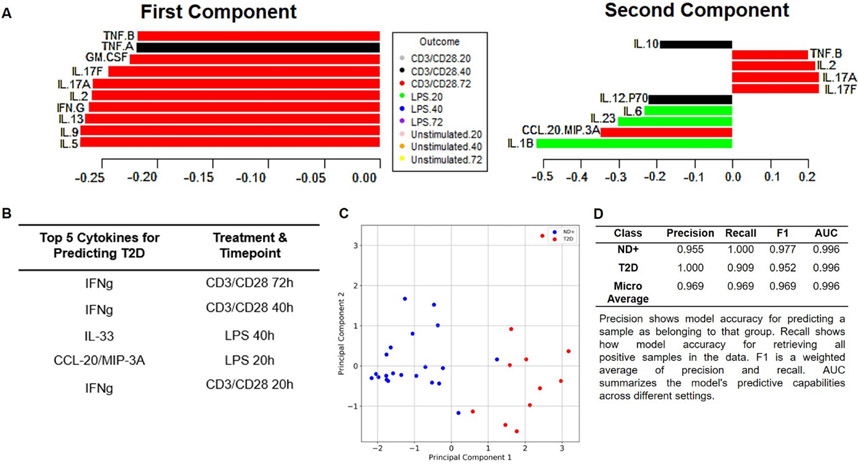
Fig. 6: Combinatorial models indicate T cells cytokine are more important than myeloid cytokines for diabetes-associated inflammation.
(A) PLSDA model that combined cytokines produced by PBMCs stimulated as indicated in the Outcome key, then ranked cytokines produced by each condition/sample from most (bottom) to least (top) important for defining inflammation in diabetes. Left panel shows cytokines in the first component (dimension) that distinguishes diabetes. Right panel ranks cytokines in the second component. (B) Ranking of top 5 cytokines that differentiate diabetes from ND+ (a combination of outcomes from non-diabetes and pre-diabetes) samples identified by mRMR. (C) Two-dimensional representation of profiles derived from mathematical combination of the top five conditions identified in panel B. Blue and red dots indicate “inflammation” from ND+ or diabetes subjects, respectively. (D) Quantification of mRMR model quality. A perfect model would have values of 1.000 for all parameters, which are defined under the table.

