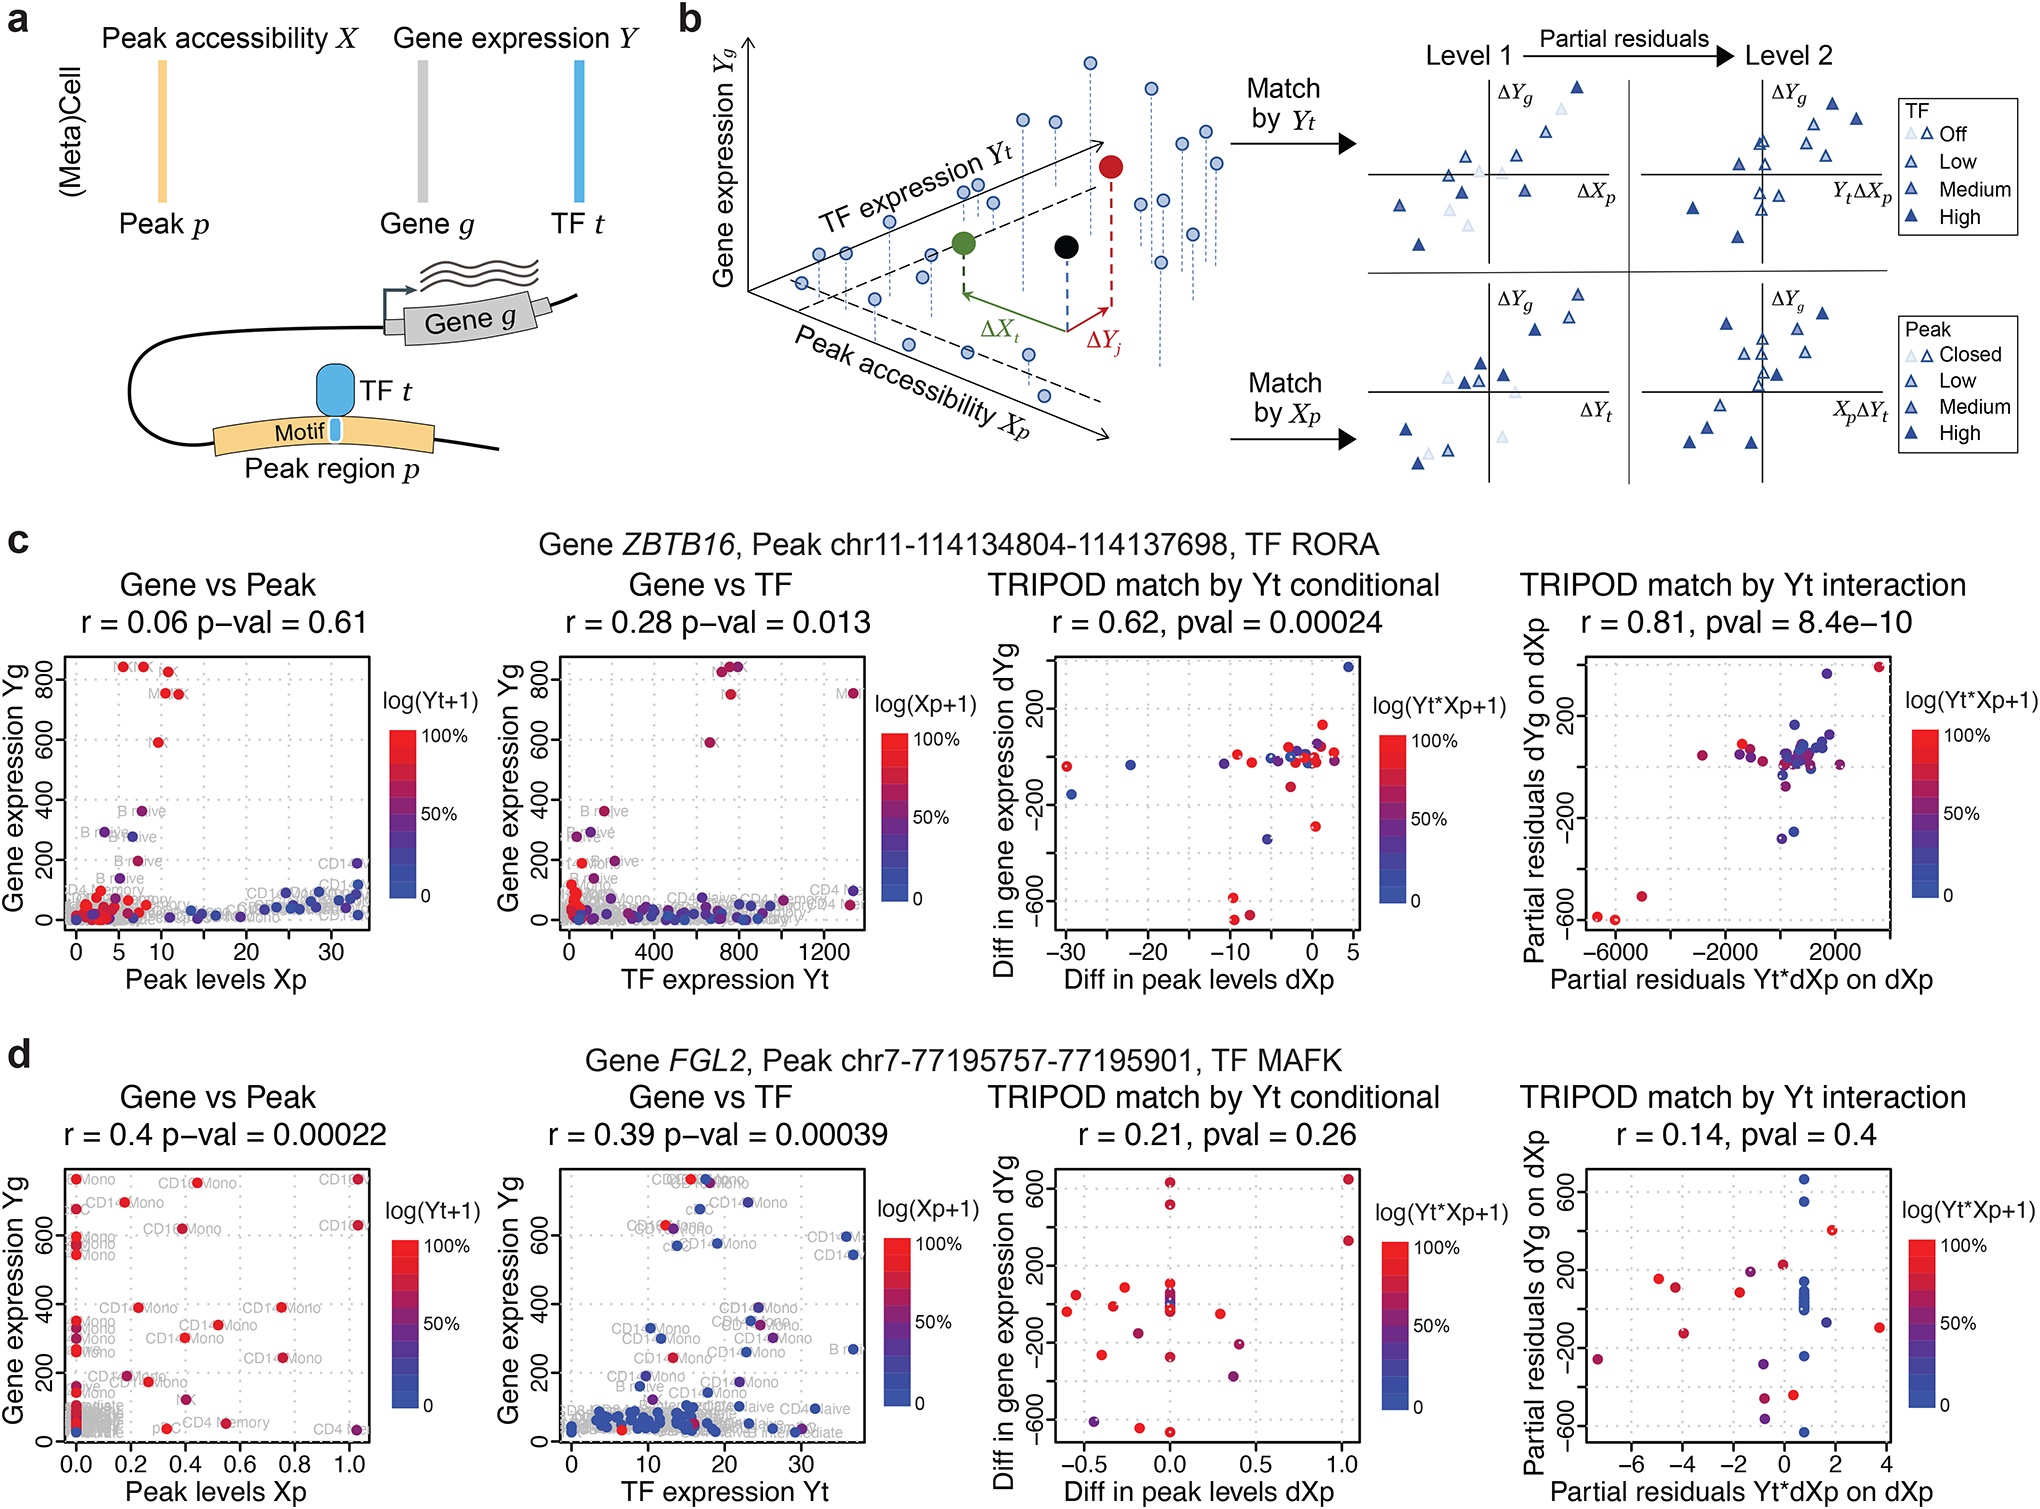
Fig. 2. TRIPOD infers peak-TF-gene trio regulatory relationships using single-cell multiomic data.

a, Data input and schematic on a peak-TF-gene trio. b, Overview of TRIPOD for inferring regulatory relationships. TRIPOD complements existing methods based on marginal associations by identifying conditional associations through matching by TF expression or peak accessibility. c, An example trio identified by TRIPOD, but not by the marginal associations due to the heterogeneity of cell-type-specific regulations. d, An example trio identified by the marginal associations, but not by TRIPOD. The peak and TF are significantly linked to the gene, yet they act through other TF and peak, and thus the regulatory trio is insignificant. The points represent cell aggregates (left two panels) and pairs of matched cell aggregates (right two panels). Genomic coordinates for the peaks are from hg38.
