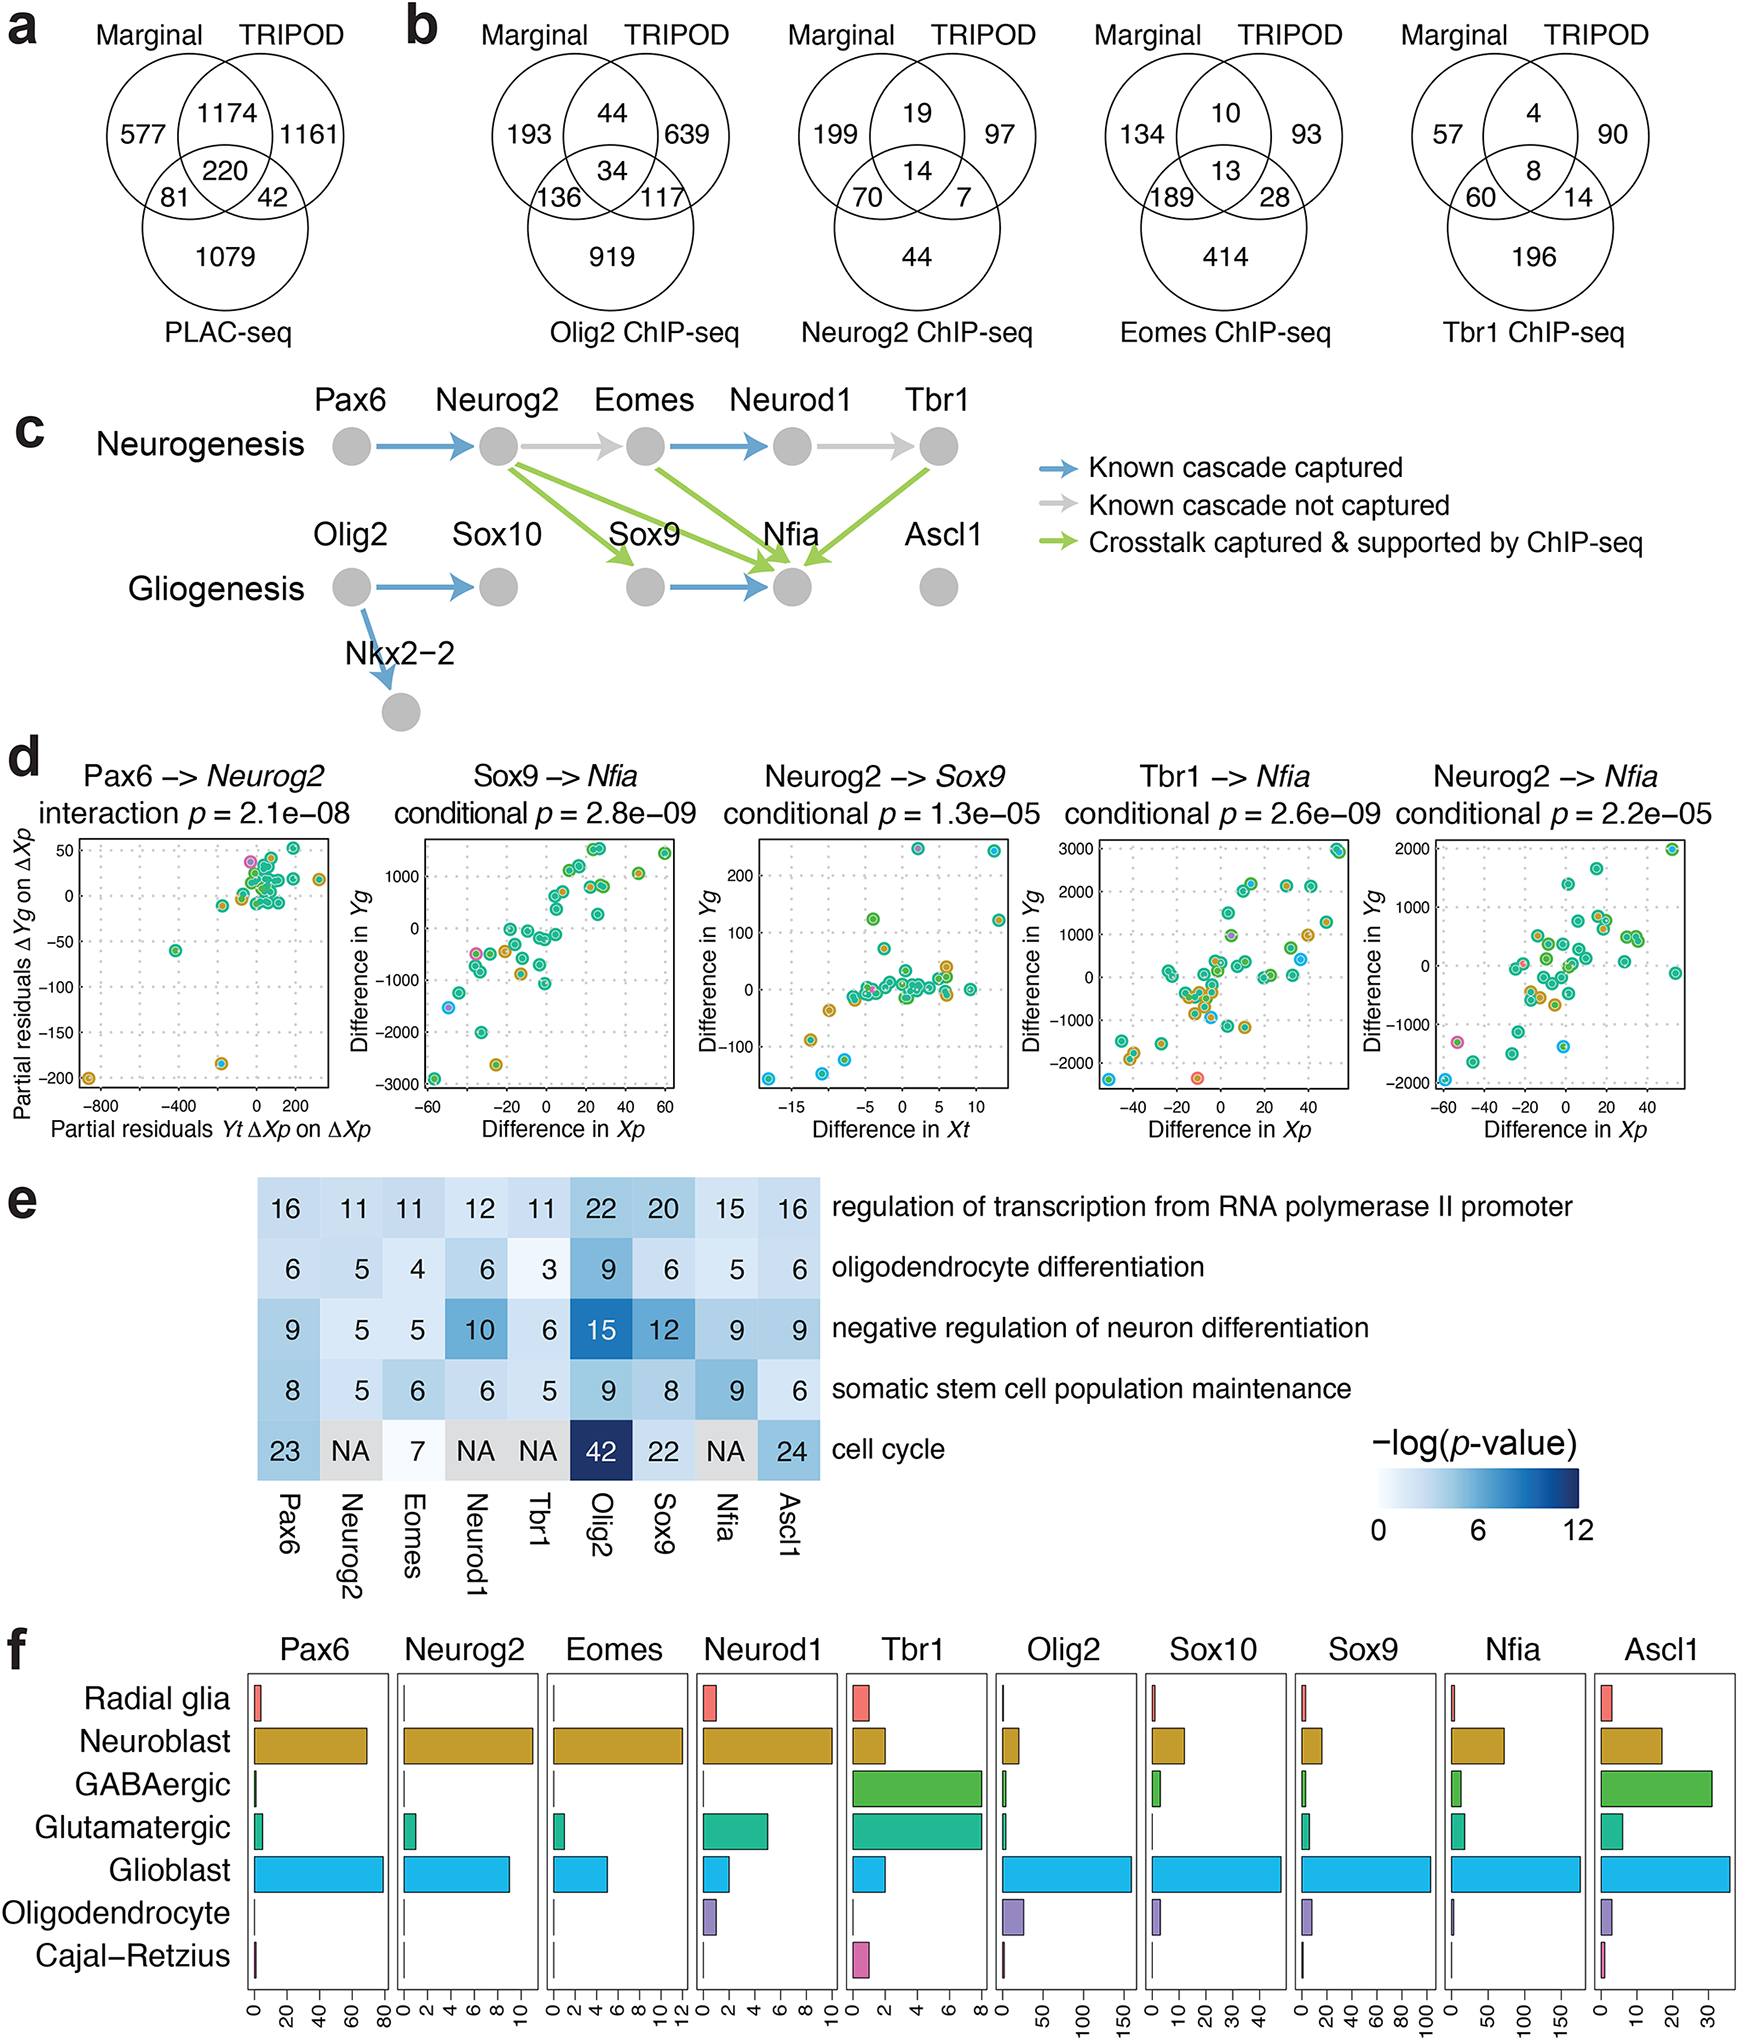
Fig. 5. TRIPOD identified regulatory relationships during mouse embryonic brain development.

a, Venn diagram of the number of peak-gene pairs captured by PLAC-seq, the marginal model, and the union set of TRIPOD’s level 1 and level 2 testing matching TF expression and peak accessibility. b, The same as a but for Peak-TF validation by ChIP-seq data for Olig2, Neurog2, Eomes, and Tbr1. c, A schematic of well-characterized TF regulatory cascades during neurogenesis and gliogenesis. d, Trio examples from known regulatory relationships, as well as from crosstalks supported by ChIP-seq data, captured by TRIPOD. e, GO analysis of putative target genes of the neurogenesis and gliogenesis TFs. The number of TRIPOD-identified target genes in the GO categories is shown. The background heatmap shows negative log p-values (FDR < 0.05) from hypergeometric tests examining enrichment of GO terms. f, Bar plots showing the number of putative cell-type-specific trios mediated by the neurogenesis- and gliogenesis-specific TFs.
