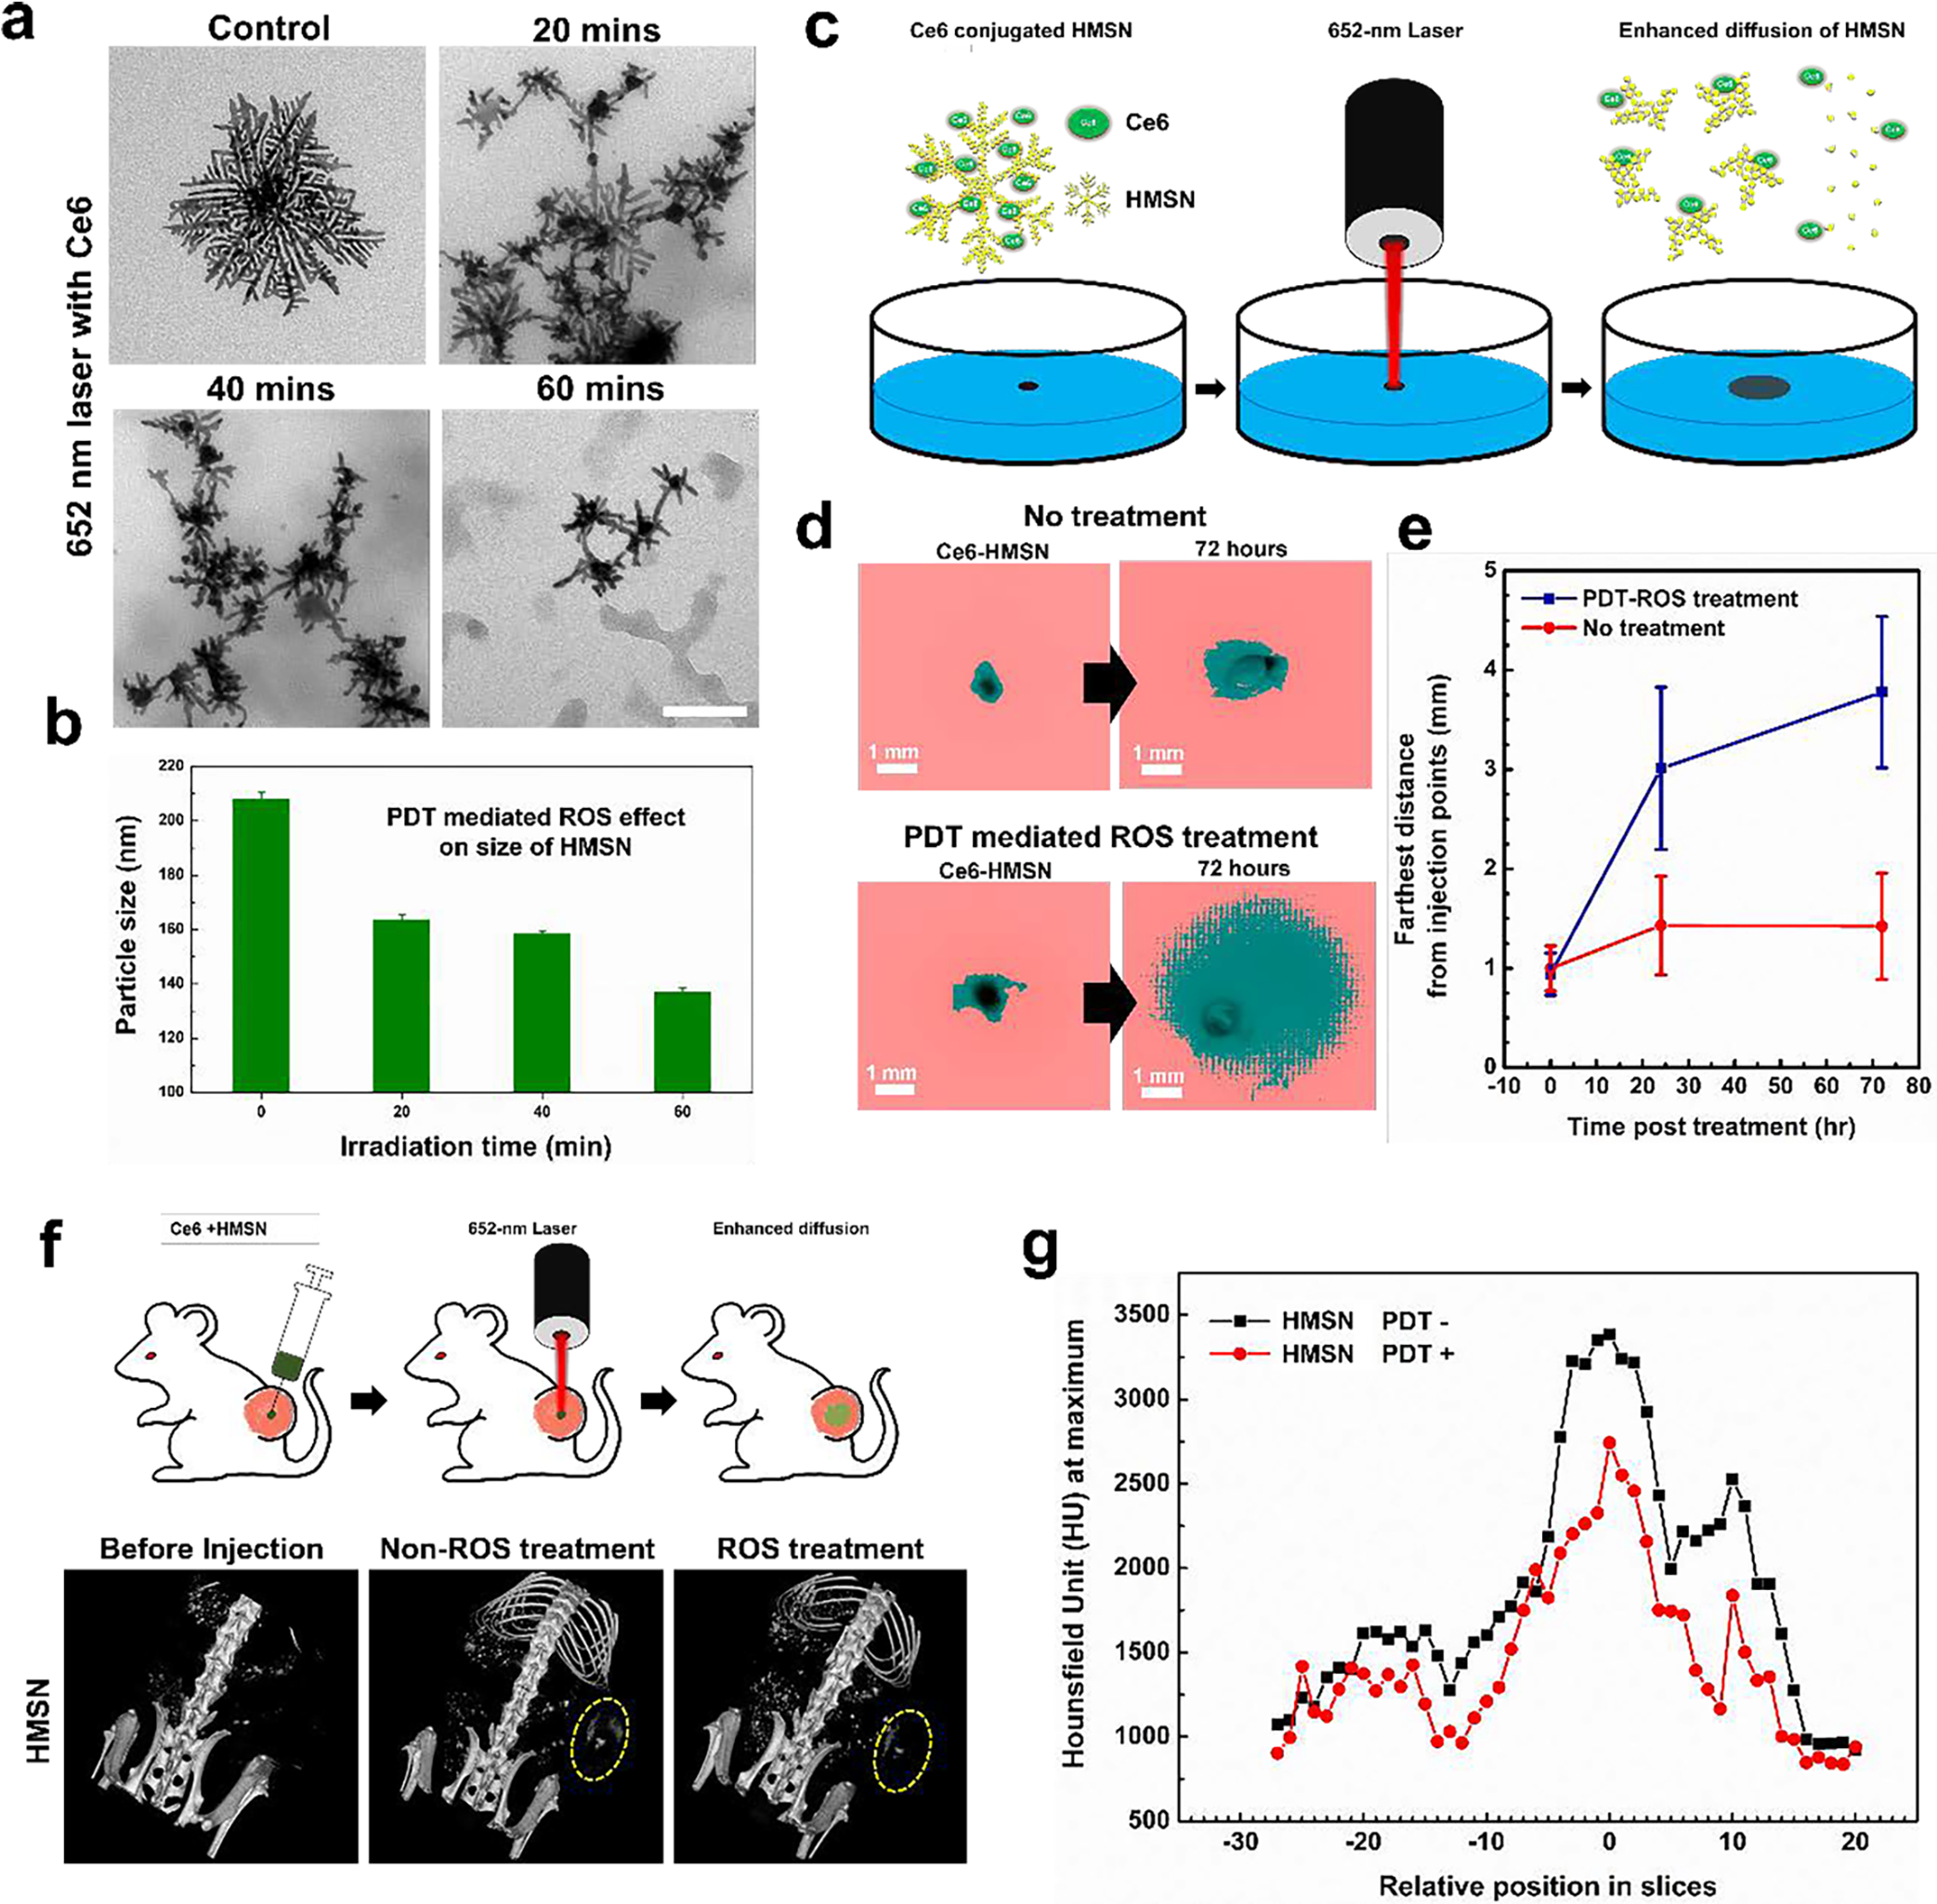
Figure 4.

a. TEM images of HMSN loaded with Ce6 after the various irradiation doses by varying the exposure time (20, 40, and 60 min with 652 nm laser (120 mW/cm2). b. Measurement of hydrodynamic size after the treatment of 652-nm laser using DLS. c. A schematic image introducing experimental set-up for evaluating the diffusion of nanoparticles after ROS treatment. d. Images taken by a digital camera before/after inducing ROS after applying threshold function for determining the diffused distance of nanoparticles in tissue mimicking agarose hydrogel. e. A measurement of the distance that HMSN traveled from the seeded point after the induction of ROS or not. f. Observation of contrast effect of gold nanoparticles (HMSN and SGNP) by computed tomographic images of tumor bearing mice treated with gold nanoparticles (HMSN and SGNP) and ROS inducing laser subsequently. g. A comparison of CT contrast effect (maximum value in ROI of each CT slices) of HMSN before and after treatment of ROS in tumor.
