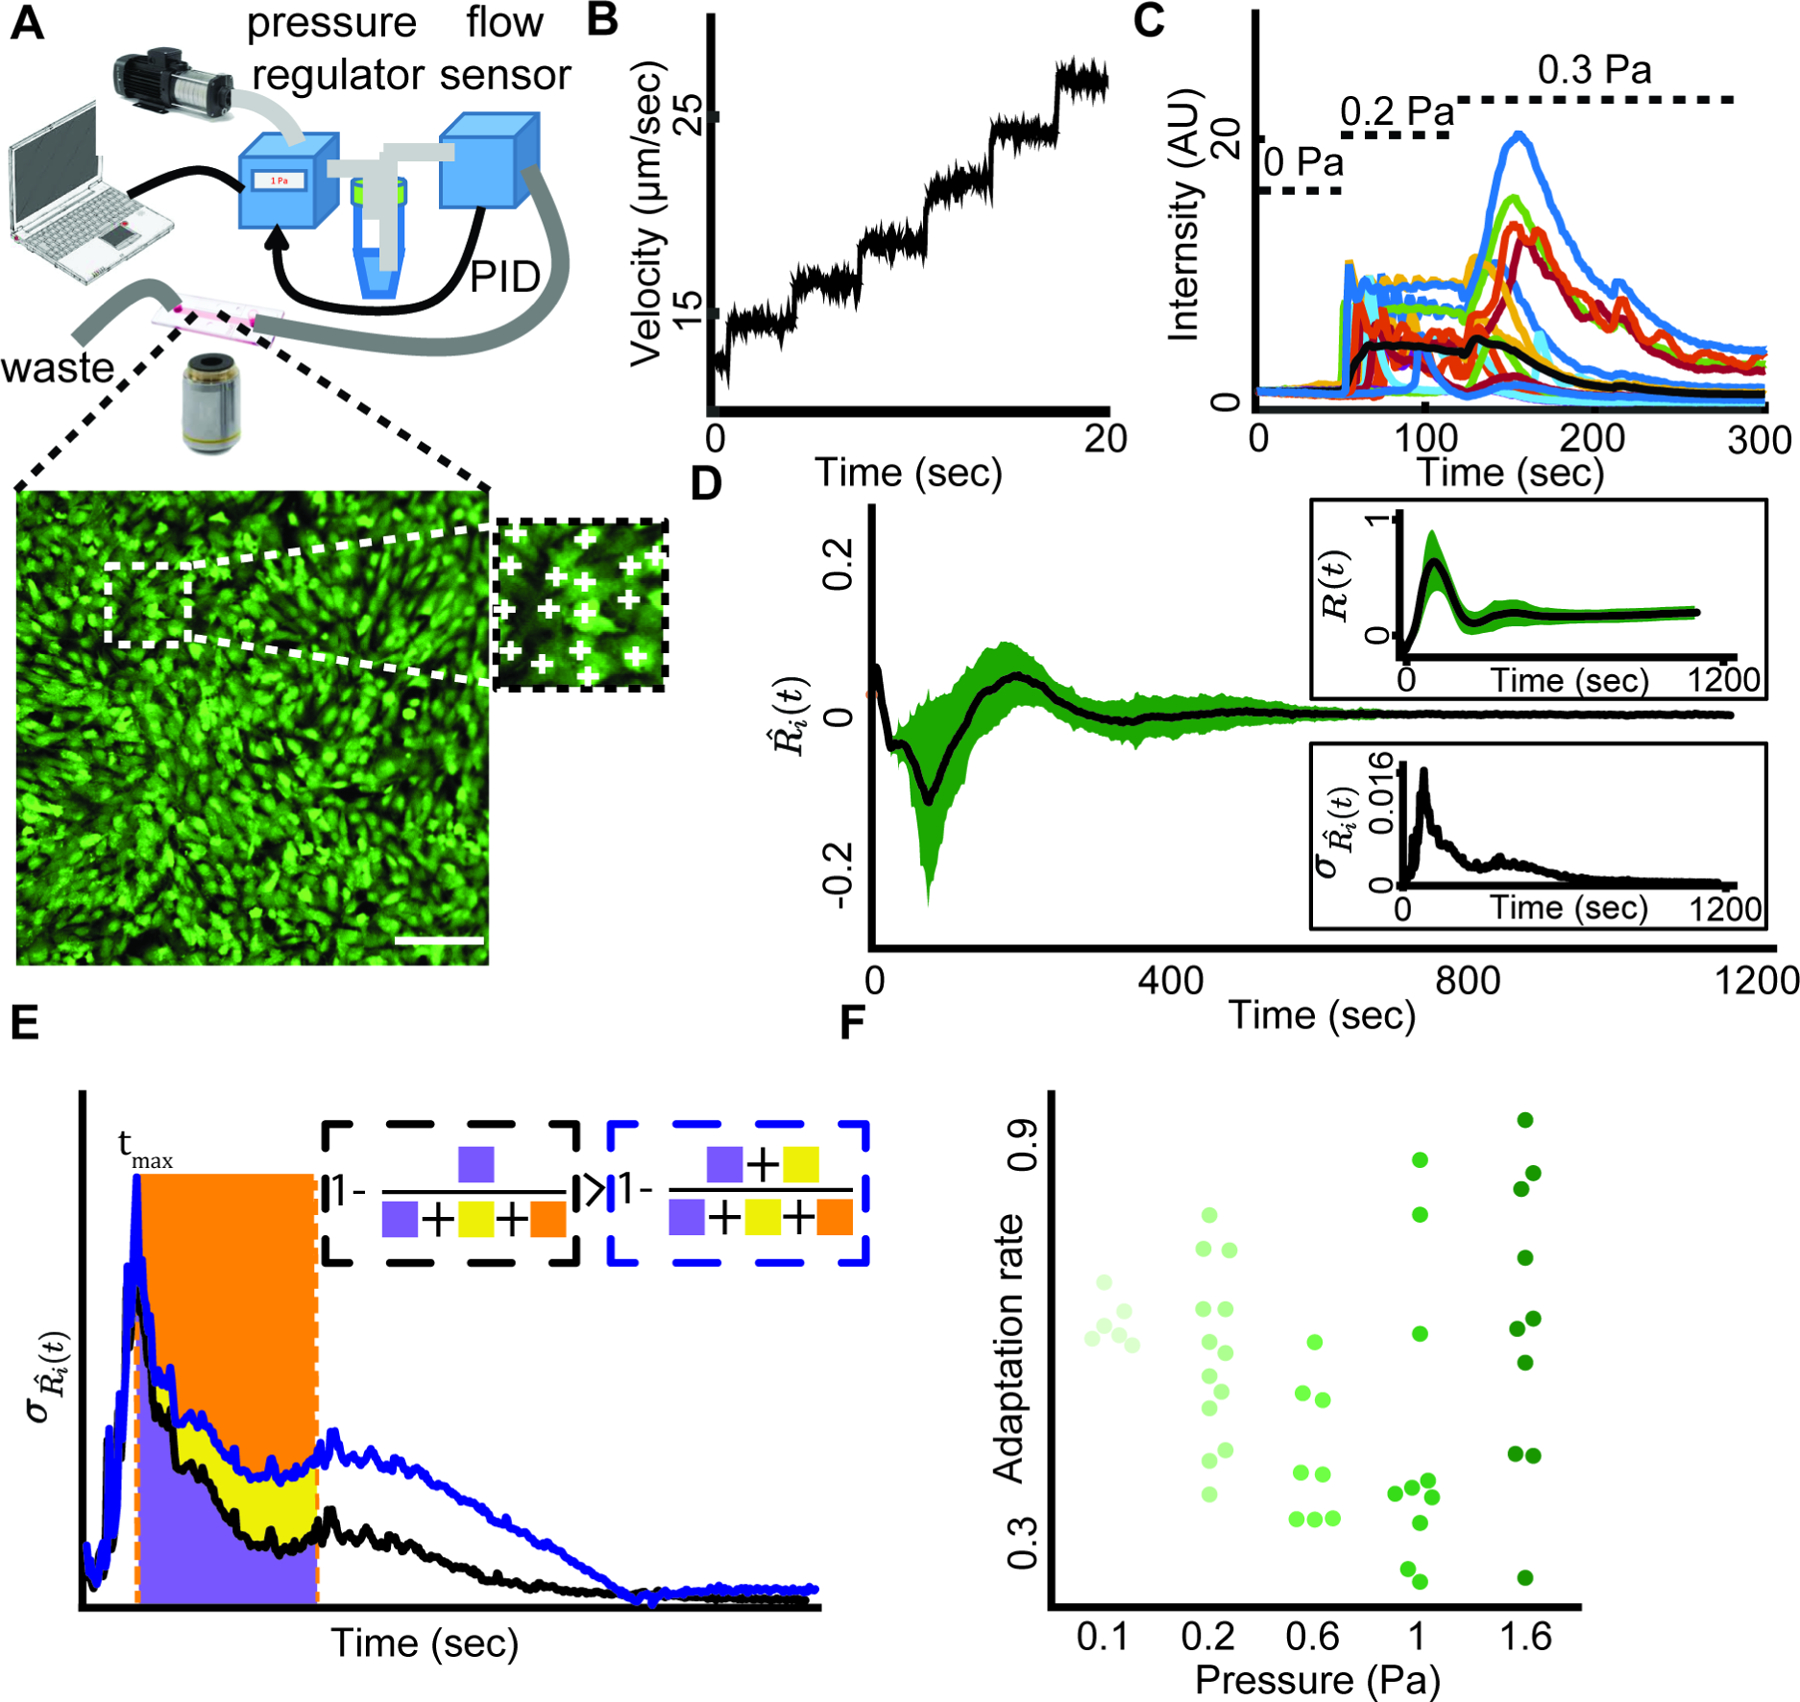
Figure 1. Collective calcium signaling of mechanosensing as a model to investigate the emergence of multicellular synchronization at the single cell resolution.

(A) In a typical experiment, a monolayer of HUVEC was cultured in a microfluidic device where fluid flow applied shear stress on the cells. Top: Schematics of the setup. The input pressure that drives a laminar flow in the single channel microfluidics is controlled by a computer interface. The pressure is regulated in real time via a PID loop consisting of a pressure regulator and a flow sensor. Bottom: A monolayer of HUVEC loaded with the fluorescent calcium indicator Calbryte-520 as a readout of the cellular response to flow shear stress. Scale bar = 50 μm. Inset: manual annotation of single cells.
(B) Particle image velocimetry verified that the regulated input pressure produces a smooth flow profile in the microfluidics channel.
(C) Cells respond to step increase in the flow shear stress. Relative intensity is the relative change of the fluorescence intensity from the basal cell level (Methods). Colored lines: individual cell calcium responses. Black line: mean response of over 400 cells in the field of view. Dashed horizontal lines indicate the time interval of 0, 0.2, 0.3 Pa shear stress correspondingly.
(D) Multicellular calcium dynamics is synchronized over time in response to external mechanical stimuli. The flow shear stress is applied from the onset of imaging (t = 0). The calcium dynamics of each cell was represented by the time-derivative of its relative fluorescent intensity. Black: mean calcium Ri(t) dynamics; Green: standard deviation. Top inset: mean (black) and standard deviation (green) of single cell calcium relative intensity (Methods) over time. Bottom Inset: standard deviation of calcium dynamics over time.
(E) Depiction of the adaption rate measure overlayed on the plot of the standard deviation of calcium dynamics overtime. There are two solid lines; the black represents faster adaptation compared to blue. Adaption rate of the black / blue solid line is one minus the ratio between the area under the curve for 400 seconds (200 frames, purple / yellow + purple area) and the area of the rectangle whose height is set by the maximum variations of individual cell dynamics (yellow + orange + purple area). See Methods for full description.
(F) Multicellular adaption rate for increasing shear stress levels. Each observation represents a biological replica. N =47 biological replicates: n = 6 (0.1 Pa), n = 13 (0.2 Pa), n = 8 (0.6 Pa), n = 10 (1 Pa), n = 10 (1.6 Pa).
