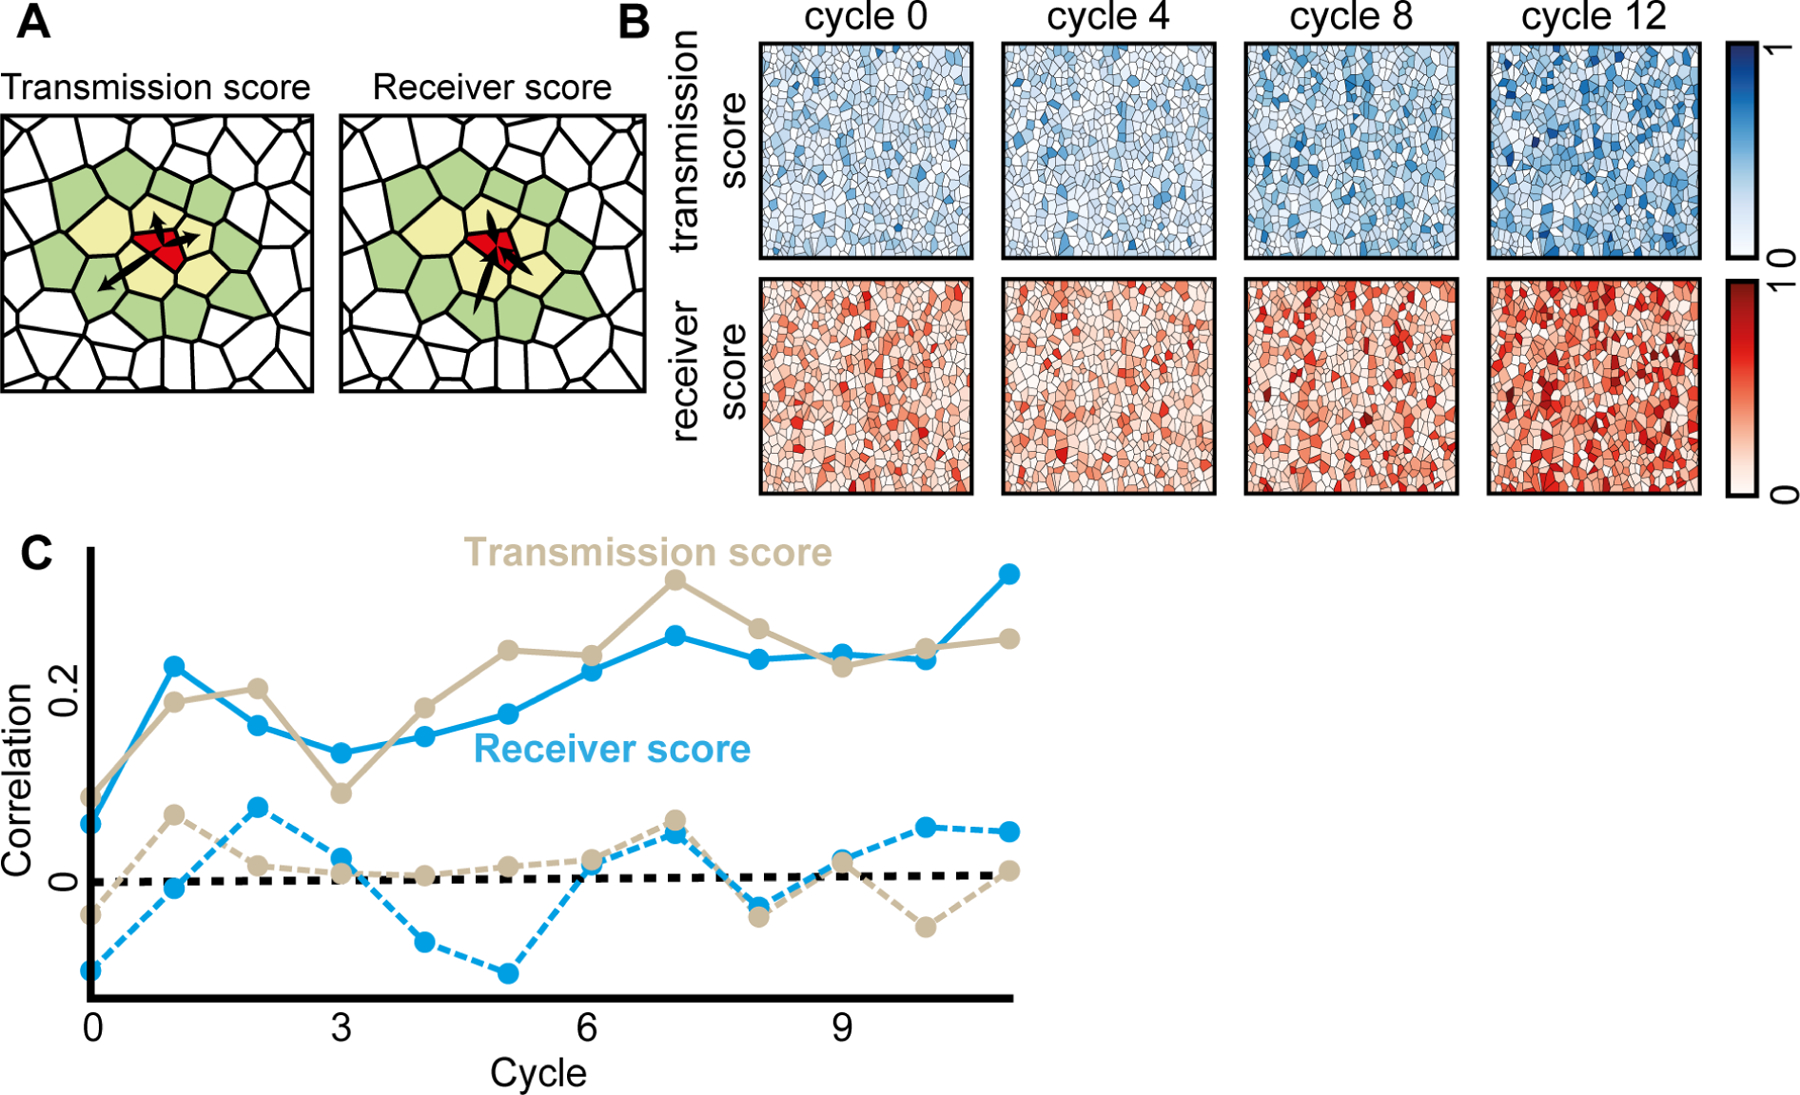
Figure 4. Functional cell memory is reinforced over time.

(A) The transmission and the receiver scores were calculated as the probability for a significant outgoing (respectively, ingoing) Granger Causality edge at topological distance of up to two (nearest (yellow polygons) and next-to-nearest neighbor cells (green polygons)). For example, the red cell in the center has total of 15 neighbors, 5 in topological distance 1 (yellow) and 10 in topological distance 2 (green). The transmission score of the red cell is 3(outgoing edges)/15 and receiver score is 3(ingoing edges)/15.
(B) The mean transmission and receiver scores increased over the cycles. Shown are the cells color coded according to their transmission (top, blue) and receiver (bottom, red) scores. The color scale is linear.
(C) Cells transmission and receiver scores were correlated across consecutive cycles (solid lines), reinforced over time (Pearson coefficient = 0.7512, p < 0.0001), and were a local cell property as validated with permutation analysis - shuffling the cells in the next cycle and calculating correlation (dashed line, see Methods). P-value for the significance of the memory ≤ 0.001 (except the first cycle: p-value of transmission and receiver score 0.021 and 0.15 correspondingly, and the third cycle’s transmission score p-value of 0.017, Fig. S8A).
