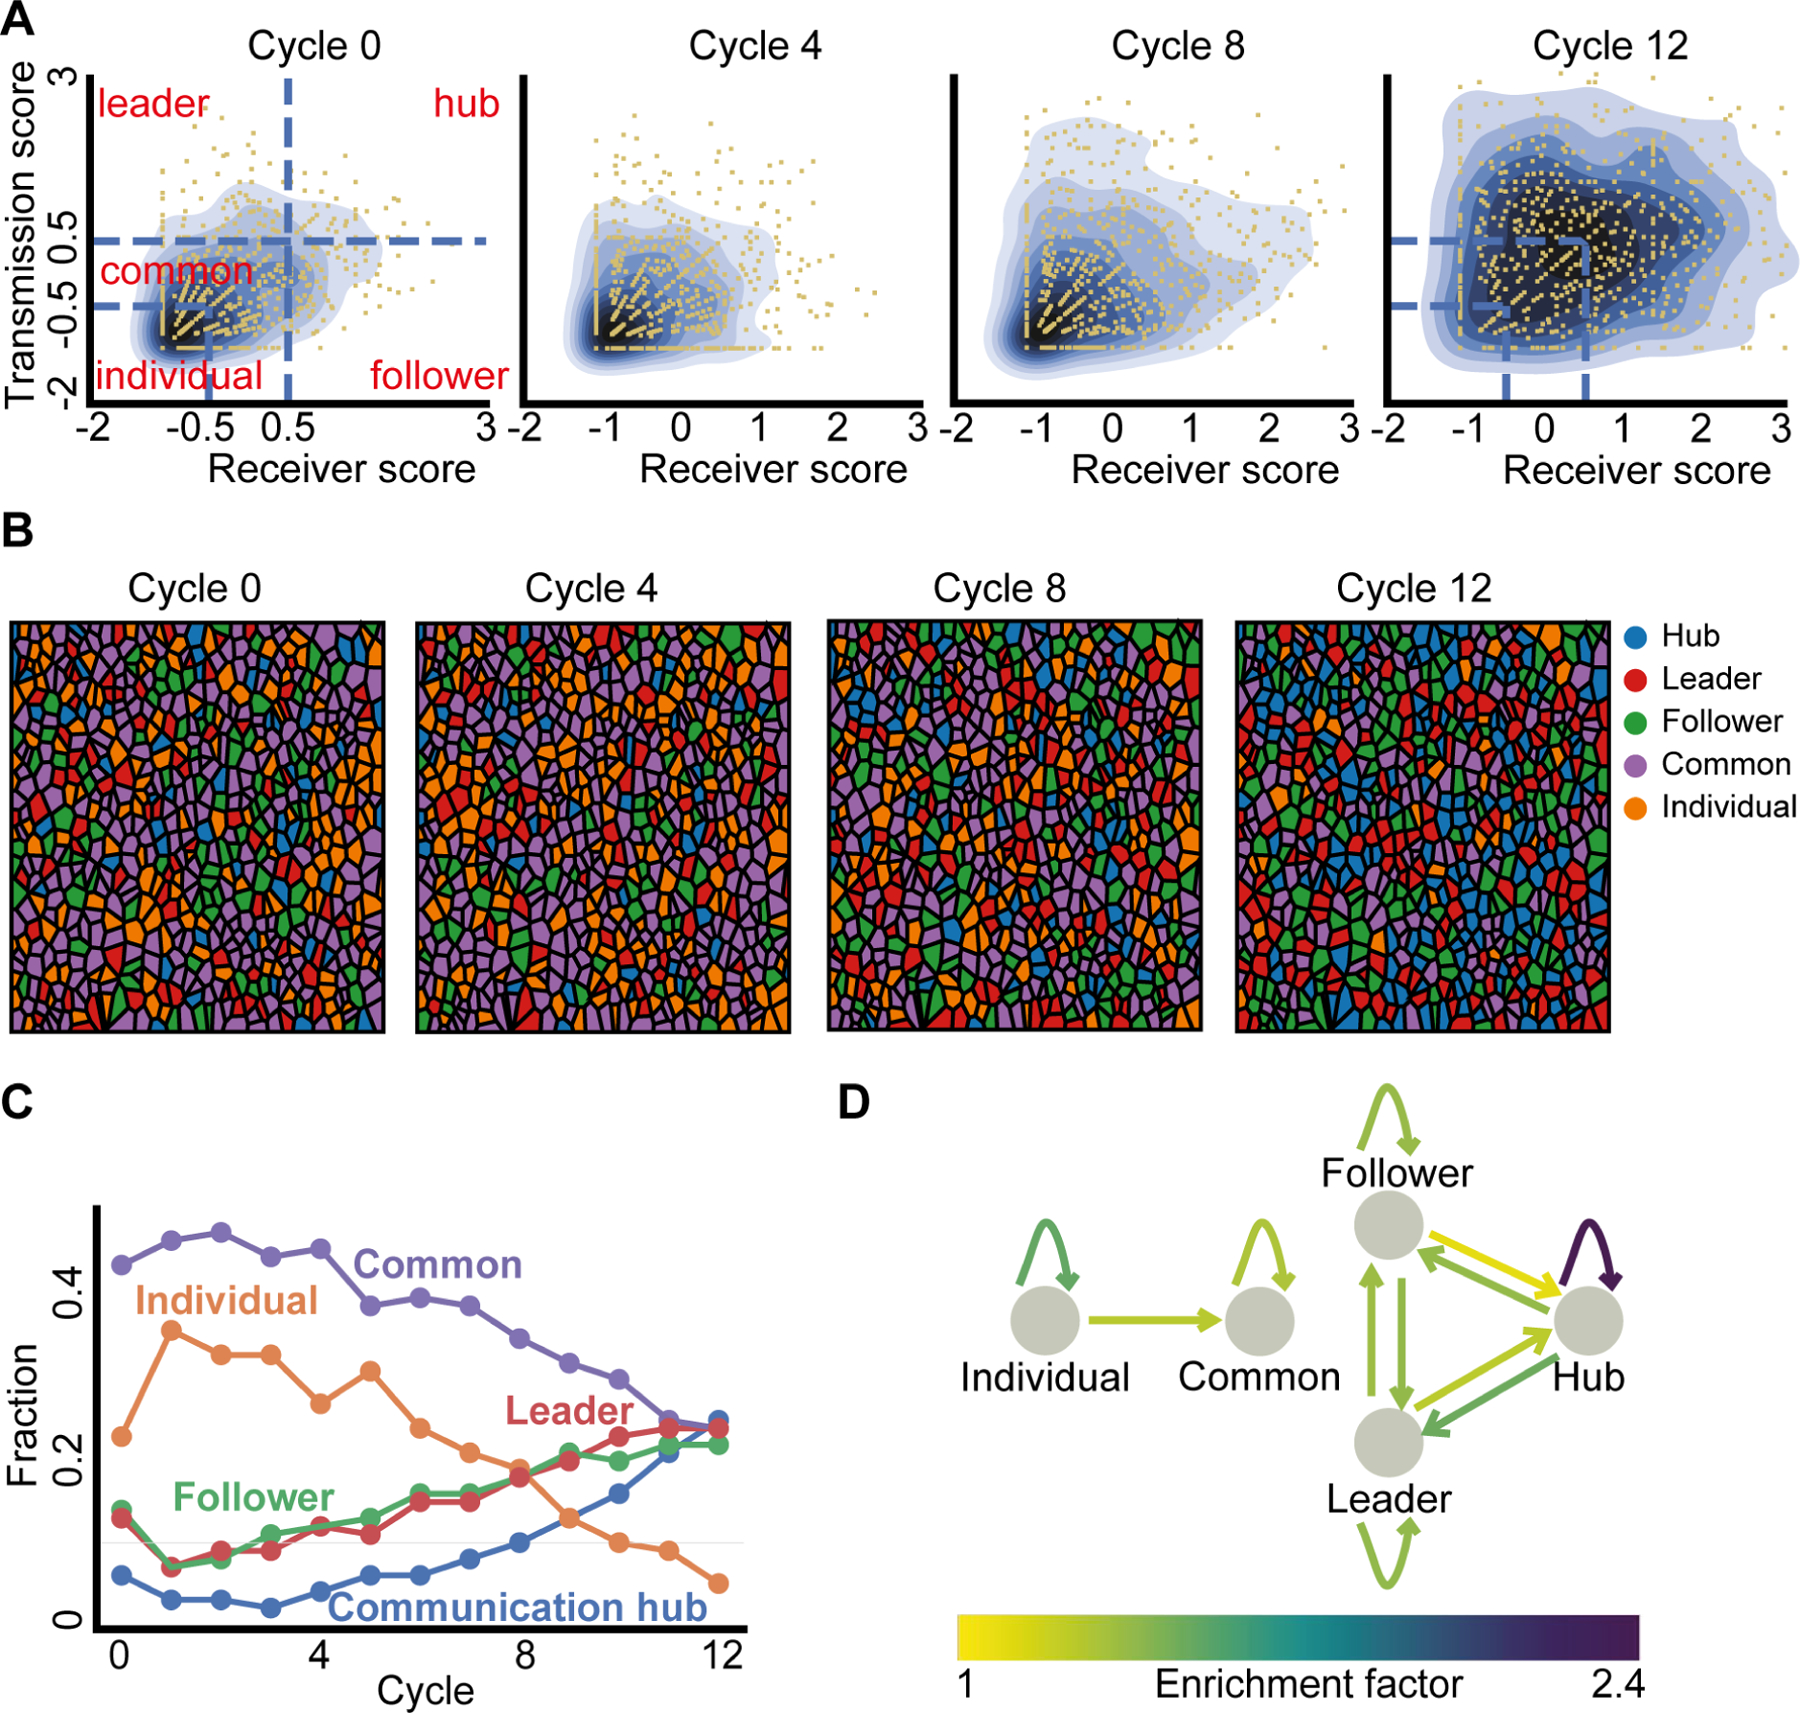
Figure 5. Cells’ communication states, state transitions and enrichment of communication hubs.

(A) Kernel density estimate plot visualization of the normalized transmission and receiver score over the cycles (blue gradient contours). Left: partitioning of the z-score normalized transmission-receiver space to five regions (blue dashed lines), each cell (yellow dot) was assigned to a group or “state” (red text) according to the region they resided at. Individual: transmission and receiver z-score < −0.5, Common: transmission z-score in the range of (−0.5, 0.5) and receiver z-score < 0.5 or receiver z-score in the range of (−0.5, −0.5) and transmission z-score < 0.5. Leader: transmission z-score > 0.5 and receiver z-score < 0.5. Follower: receiver z-score > 0.5 and transmission z-score < 0.5. Hub: transmission and receiver z-score > 0.5.
(B) Visualizing the cells’ communication states over the cycles with color code.
(C) Fraction of cells at each communication state over the cycles.
(D) Enrichment factors of cellular state transition. Depiction of the single cell transitions between states that were enriched beyond the expected values of a null model. The null model was based on the marginal distribution of the states (Fig. S10, Methods). Shown are edges with fold increase over 1 (linear color code).
