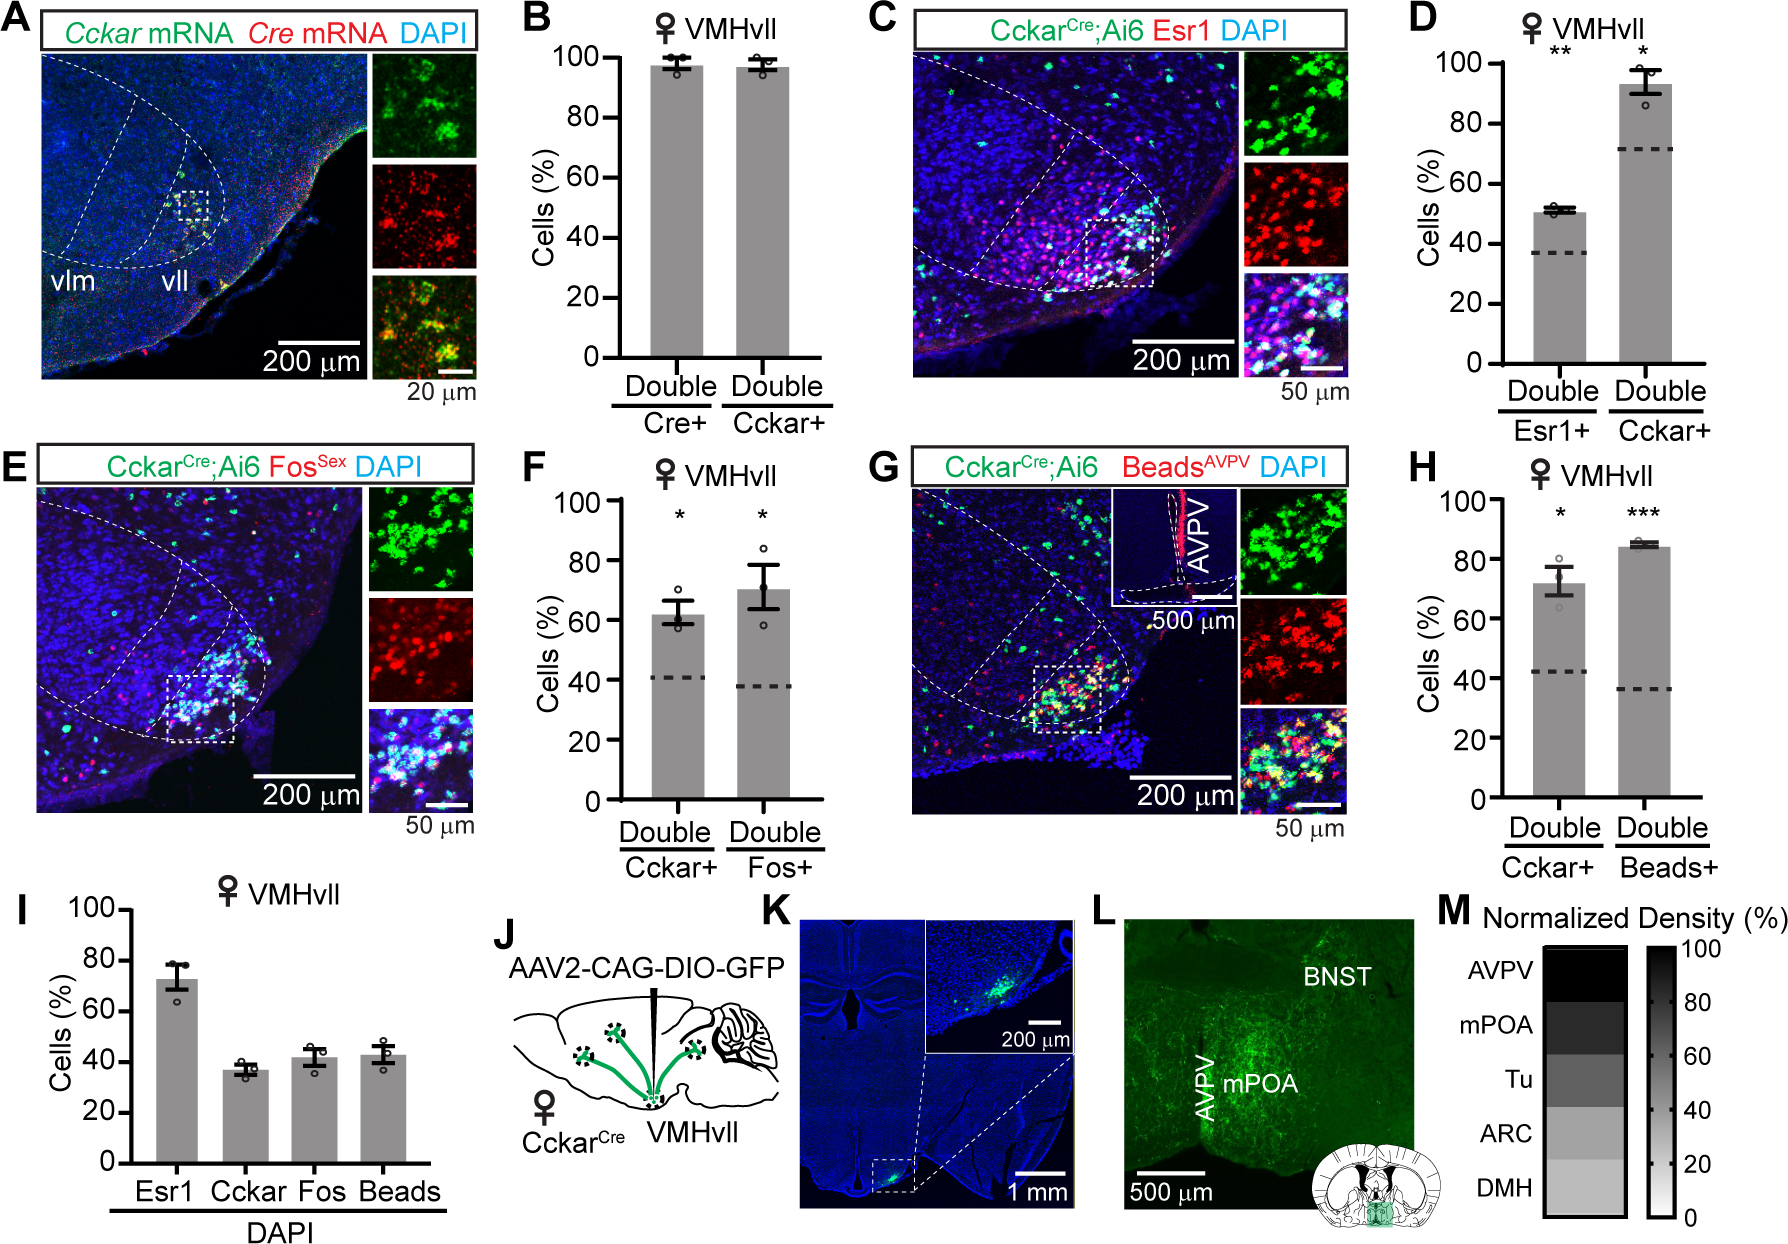
Figure 1. Characterization of VMHvllCckar cells.

(A) Cckar and Cre mRNA in the VMHvl of a CckarCre female mouse.
(B) Overlap between VMHvll Cre and Cckar mRNA.
(C) Esr1 staining in the VMHvl of a CckarCre;Ai6 female mouse.
(D) Overlap between VMHvll Esr1 and Cckar.
(E) Immunostaining of sexual behavior induced Fos (FosSex) in the VMHvl of a CckarCre;Ai6 female mouse.
(F) Overlap between VMHvll Cckar and FosSex.
(G) Retrobead-labeled VMHvll cells from AVPV of a CckarCre;Ai6 female mouse. Insert shows injection site.
(H) Overlap between Cckar and retrobead cells in VMHvll.
(I) The percentage of Esr1, Cckar, FosSex and retrobeads cells in VMHvll in DAPI+ cells.
(J) Viral strategy for axon tracing of VMHvllCckar cells.
(K) GFP expression in the VMHvllCcka cells. Inset, the zoom-in view of the boxed area.
(L) GFP expressing terminals from VMHvllCckar at AVPV, BNST and mPOA.
(M) The top five brain regions that receive inputs from VMHvllCckar.
In (A, C, E, G), right shows the enlarged view of the boxed area. Dotted lines demarcate VMH subdivisions. In (D, F, H), horizontal dashed lines indicate the chance level of overlap.
Data are mean ± s.e.m. (D, F, H) One sample t test. *p<0.05; **p<0.01; ***p<0.001.
n = 3 animals (B, D, F, H, I, M).
See also Figures S1–S3.
