
Figure 2. Chemogenetic inhibition of VMHvllCckar cells suppresses female sexual behaviors.
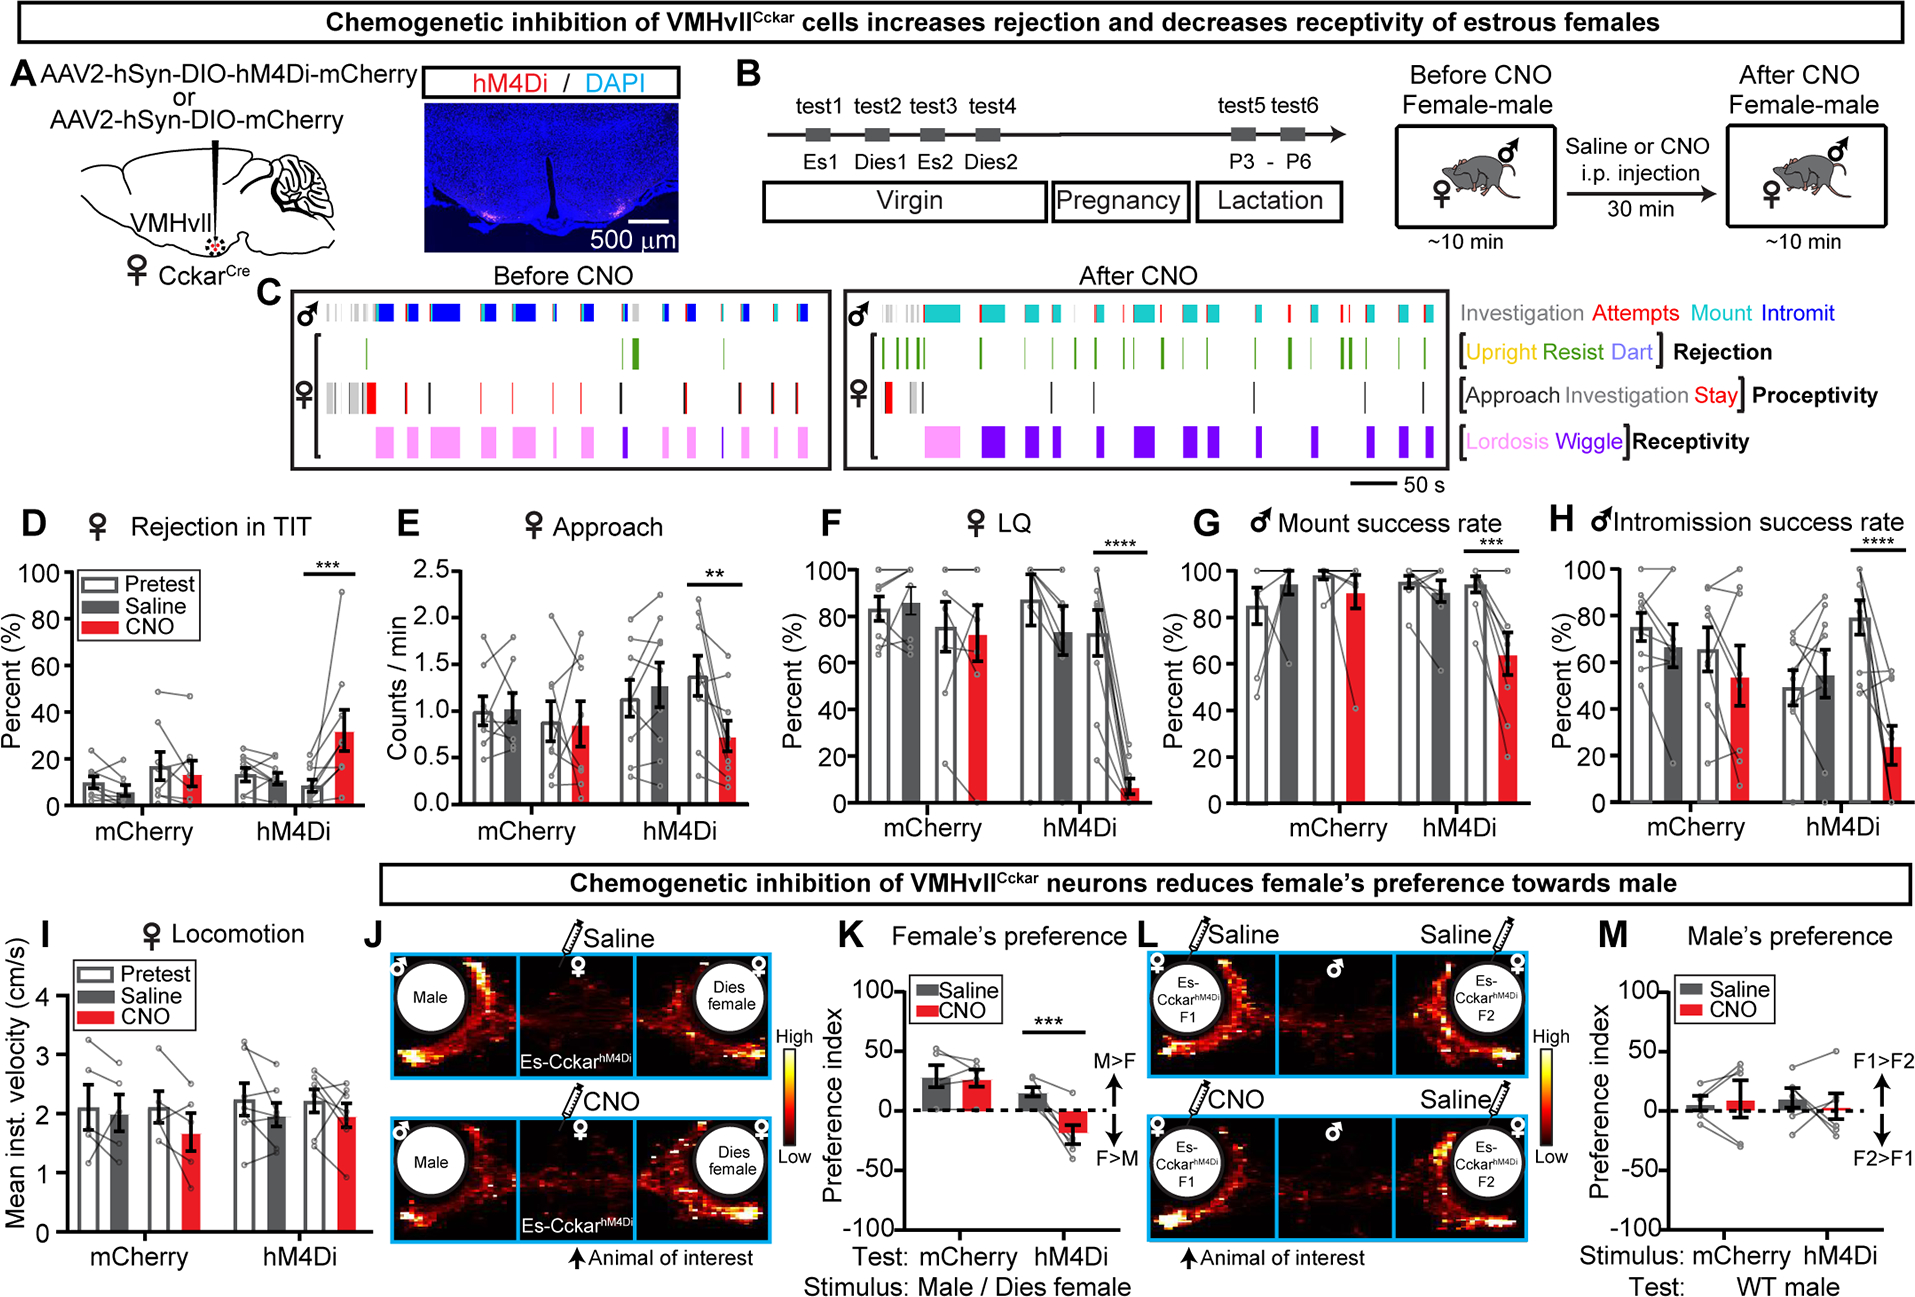
(A) Viral strategy and histology.
(B) Experimental timeline.
(C) Behavior raster plots of a male and an estrous CckarhM4Di female before and after CNO injection to the female.
(D-I) Percentage of time female spent on rejecting the male (summation of upright, resist and dart) during total interaction time (D), frequency of approach initiated by females (E), lordosis quotient (LQ) (F), male mount success rate (G), male intromission success rate (H), average locomotion velocity of solitary females calculated over 30 minutes (I) before and after saline or CNO injection.
(J) The distribution of female’s body center location after saline or CNO injection.
(K) Test female’s preference index (PI). Positive values indicate male preference.
(L) The distribution of the male’s body center location. The stimulus animals are injected either both with saline (top) or one with CNO and one with saline (bottom).
(M) Comparison of male’s preference index. Positive values indicate preference of CNO injected females.
Data are mean ± s.e.m. (D-I, K, M) Two-way ANOVA followed by Sidak’s multiple comparisons test. **p<0.01; ***p<0.001; ****p<0.0001.
n = number of animals. mCherry: n=8 (D-H), 5 (I, K, M); hM4Di: n=9 (D-H), 7 (I), 6 (K, M).
See also Figures S4–S8.