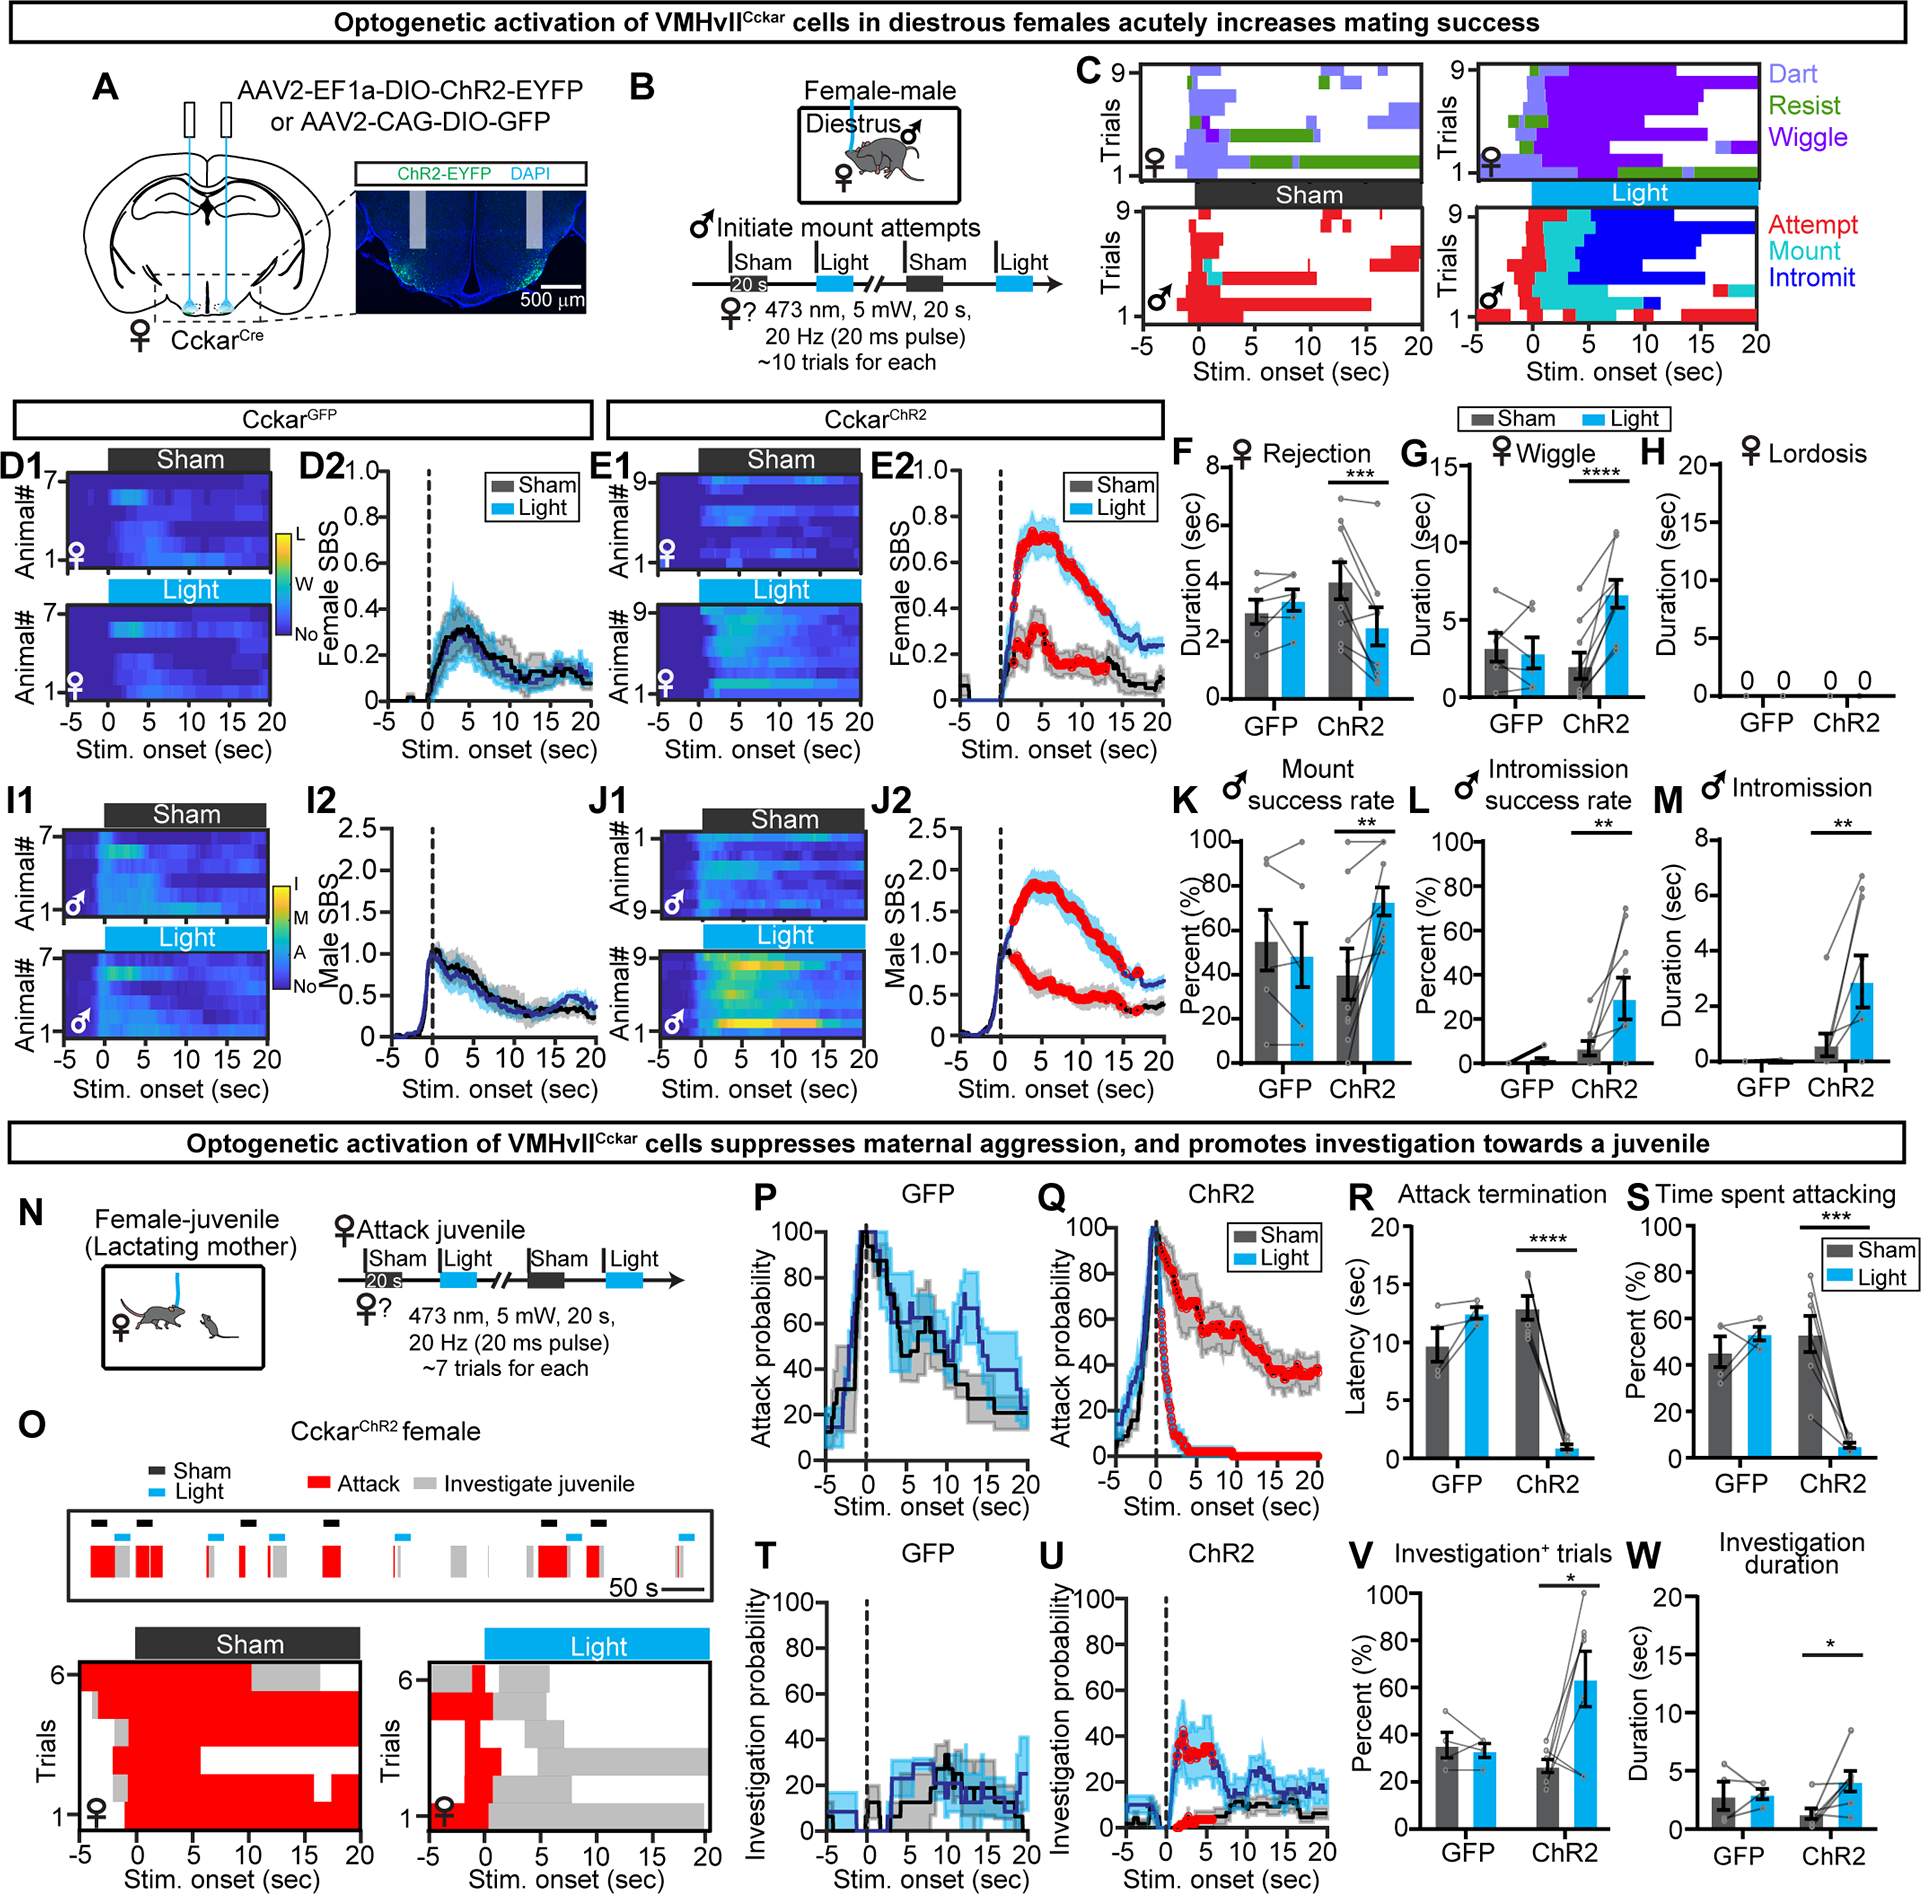
Figure 5. Optogenetic activation of VMHvllCckar cells increases mating success and suppresses maternal aggression in females.

(A) Viral strategy and histology. Shades indicate optic fiber tracks.
(B) Behavioral paradigm and stimulation protocol.
(C) Behavior raster plots of a female (top) and its paired male (bottom) during sham and light stimulation of the female.
(D) Heatmaps (D1) and PSTHs (D2) showing female SBS aligned to the onset of sham or light stimulation of all diestrous CckarGFP females. L: lordosis; W: wiggle: No: no mating.
(E) Same as (D), but for CckarChR2 females.
(F-H) The average duration females spent on rejecting the male (F), wiggle (G) and lordosis (H) during sham and light stimulation of CckarGFP and CckarChR2 females.
(I-J) Male SBS aligned to the onset of sham or light delivered to the paired CckarGFP (I) or CckarChR2 females. I: intromission; M: mount: A: attempt to mount; No: no mating.
(K-M) Male mount success rate (K), intromission success rate (L), and average male intromission duration (M) during sham and light trials when the male was paired with CckarGFP or CckarChR2 females.
(N) Behavioral paradigm and stimulation protocol. Stimulation started upon attack initiation.
(O) Behavior raster plots of a lactating CckarChR2 female with a juvenile intruder upon sham and light simulation.
(P and Q) PSTHs of attack probability of lactating CckarGFP (P) and CckarChR2 (Q) females aligned to sham and light stimulation onset.
(R) The latency to terminate attack from the light or sham onset.
(S) The percent of time the females spent on attacking the juvenile during the sham and light periods.
(T and U) PSTHs of investigation probability of lactating CckarGFP (T) and CckarChR2 (U) females aligned to sham and light onset.
(V) Percentage of sham and light trials with female investigation of a juvenile.
(W) Juvenile investigation duration during sham and light trials.
Data are mean ± s.e.m. (D2, E2, I2, J2, P and Q, T and U) Two-way ANOVA with repeated measures, followed by Sidak’s multiple comparisons test. Red dots indicate periods when SBS differ significantly (p<0.05) between sham and light trials. (F-G, K-M, R-S, V-W) Two-way ANOVA with Sidak’s multiple comparisons test. *p<0.05; **p<0.01; ***p<0.001; ****p<0.0001;
n = number of animals. GFP: n=6 (D-M), 4 (P, R-S, T, V-W); ChR2: n=9 (D-M), 7 (Q, R-S, U, V-W).
See also Figure S11.
