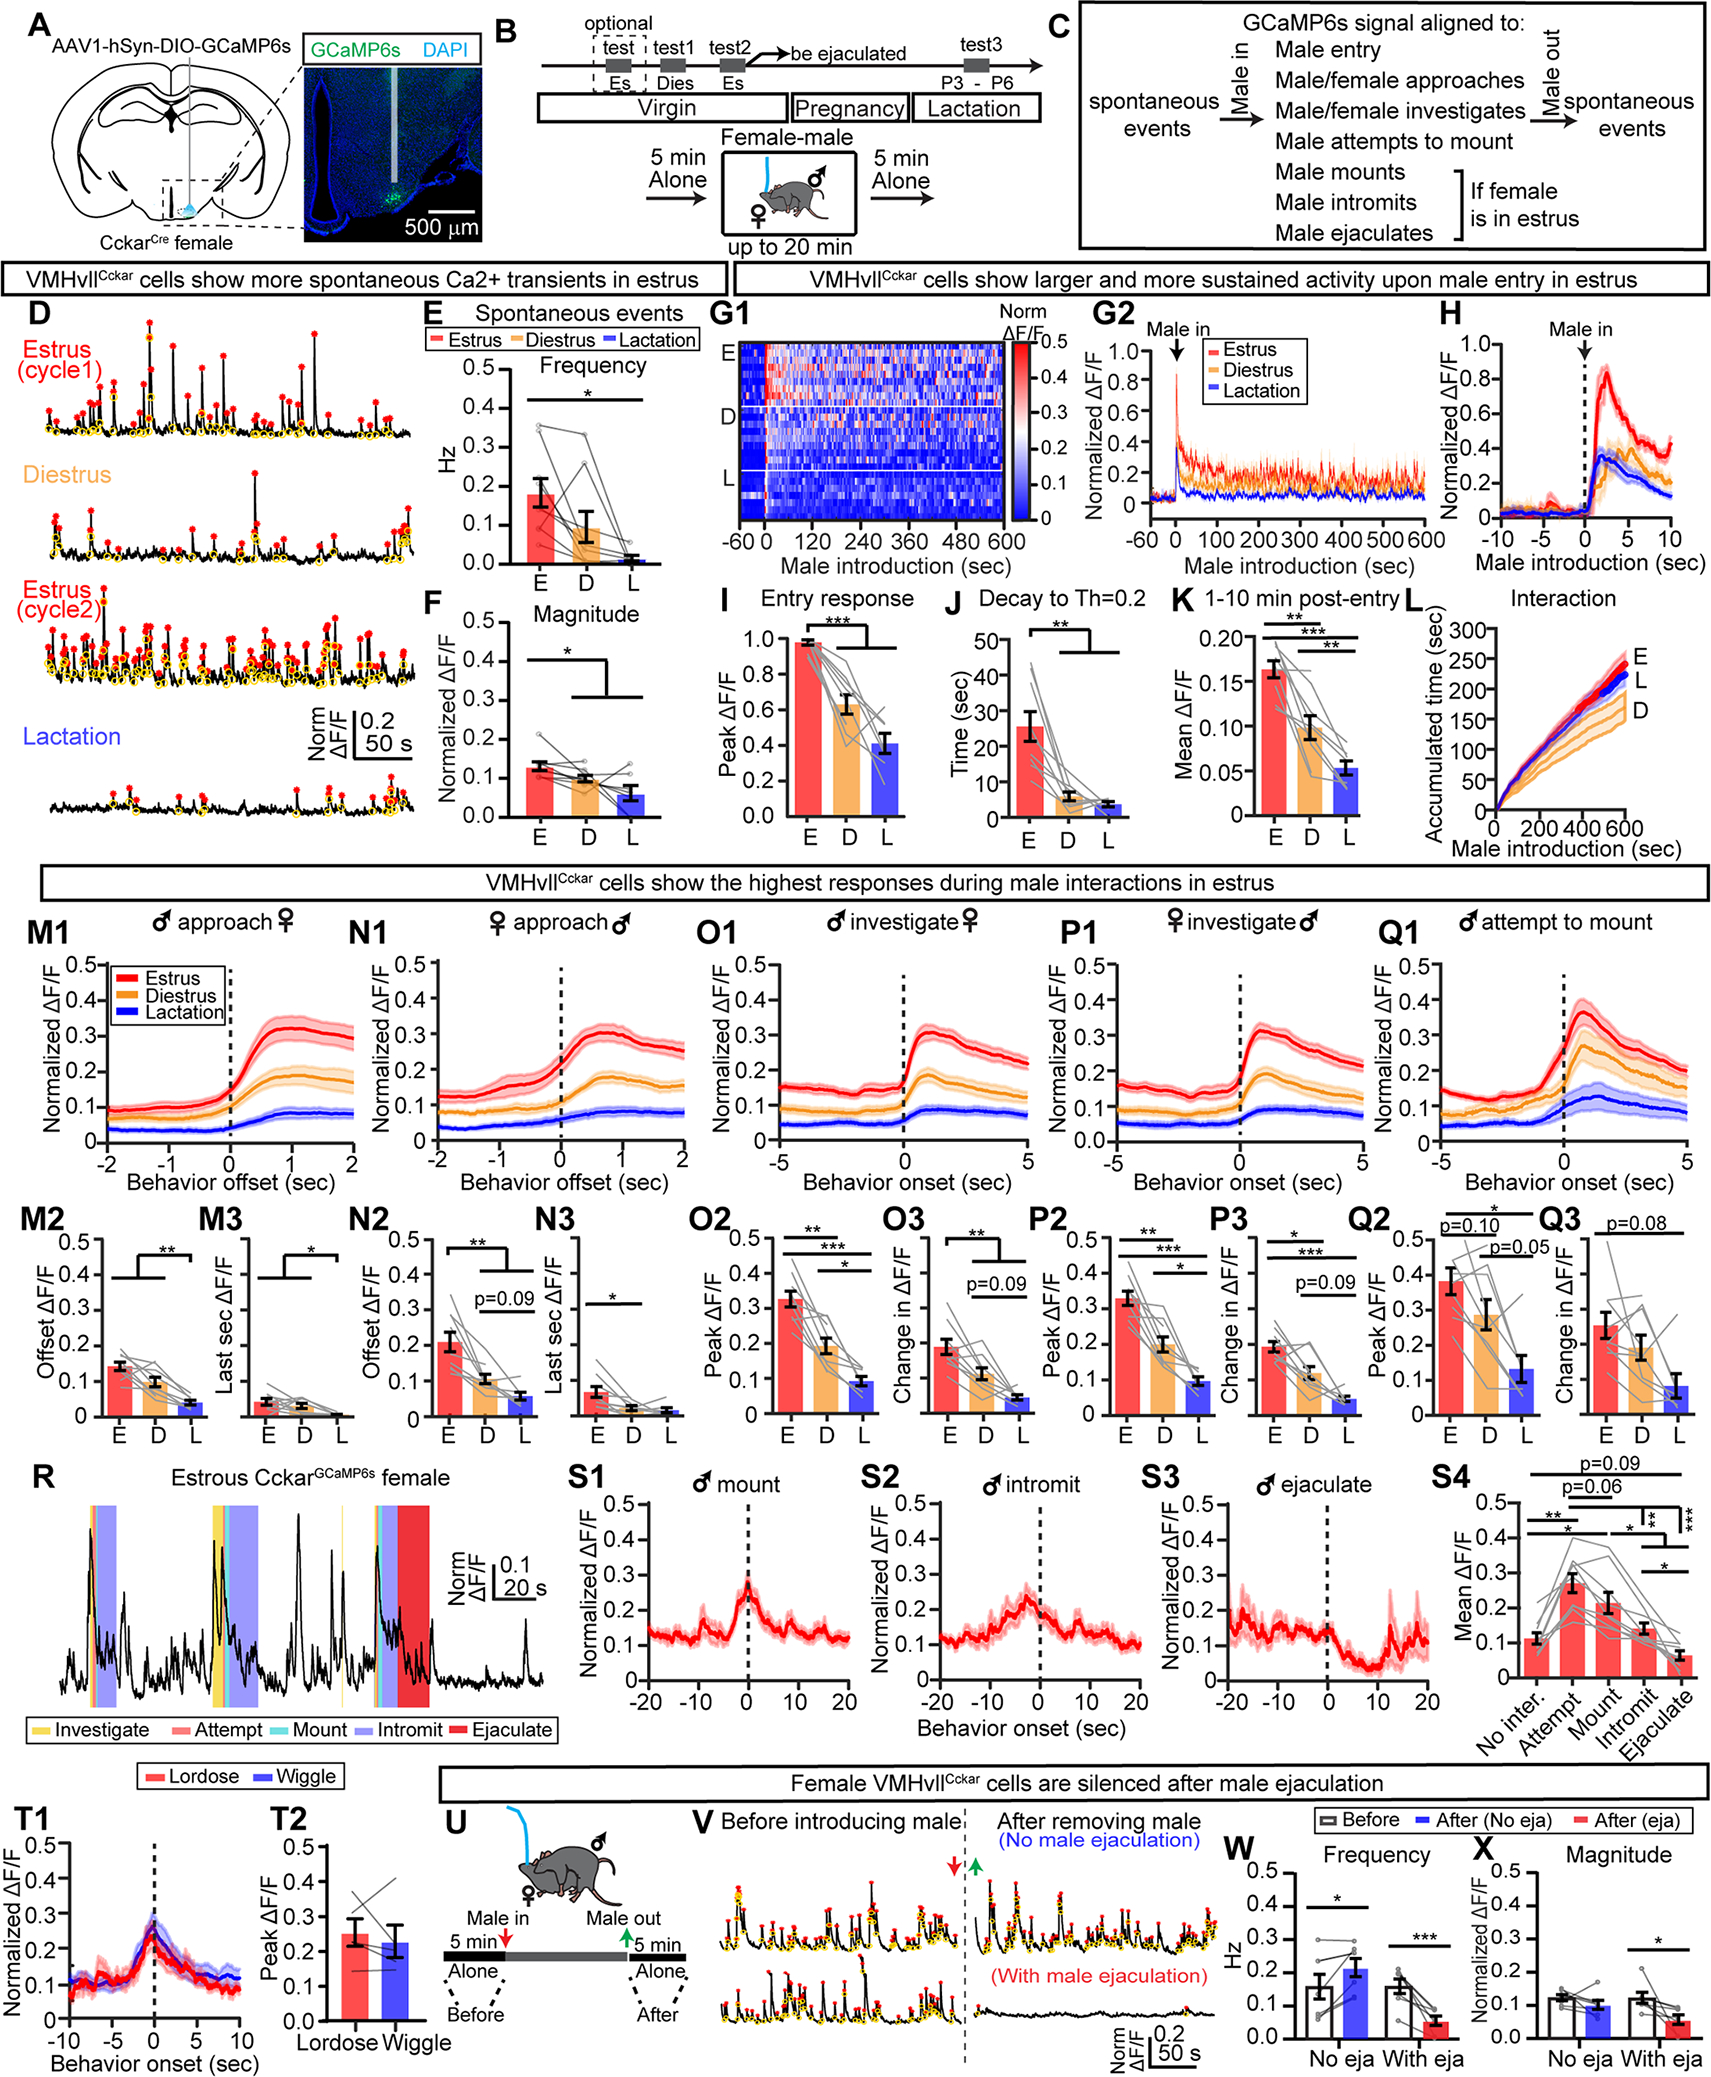
Figure 6. Reproductive-state dependent responses of female VMHvllCckar cells during male interaction.

(A) Fiber photometry recording and histology. Shade indicates optic fiber track.
(B) Recording timeline.
(C) Parameters analyzed in the figure.
(D) Representative traces of Ca2+ signal of VMHvllCckar cells in a solitary females during different reproductive states. Red: transient peaks. Yellow: transient troughs.
(E-F) Frequency (E) and magnitude (F) of spontaneous Ca2+ events during estrus diestrus and lactation.
(G) Heatmap of Ca2+ traces from individual females (G1) and the average of all females under a specific reproductive state (G2) during male-female interaction. For each animal, signals were normalized to 0–1 by the maximum Ca2+ signal across all recording sessions of that animal.
(H) Male entry aligned PETHs of Ca2+ signals from all animals under a specified reproductive state.
(I) Peak ΔF/F within the first 60 s after male entry.
(J) The time for the normalized ΔF/F to reach 0.2 after peaking during the male entry.
(K) Mean ΔF/F from 1–10 minutes after male entry.
(L) The accumulated male-female interaction time over 10 minutes when the females were under different reproductive states.
(M1-M3) PETHs of normalized ΔF/F aligned to the offset of male-initiated approach towards the female (M1), value at the offset of approach (M2), change in normalized ΔF/F during the last second of approach (M3).
(N1-N3) Same as (M1-M3) but for female-initiated approach.
(O1-O3) PETHs of normalized ΔF/F aligned to the onset of male investigation of the recording female (O1), Peak ΔF/F during male investigation (O2), and the difference between the peak response and the mean ΔF/F at the preceding baseline (−3 to −1 s) (O3).
(P-Q) Same as (O). Signal aligned to the onset of female investigation of the male (P1-P3) and onset of male mounting attempts (Q1-Q3).
(R) Trace of normalized ΔF/F from an estrous female during copulation. Color shades indicate male behaviors.
(S1-S3) PETHs of normalized ΔF/F aligned to the onset of male mounting (S1), intromission (S2) and ejaculation (S3).
(S4) Mean signal during various male sexual behaviors.
(T1) PETHs of normalized ΔF/F aligned to the onset of female lordosis (red) and wiggling (blue).
(T2) Peak signal during wiggling and lordosis.
(U) The time windows for spontaneous Ca2+ transient analysis.
(U) Example traces of Ca2+ signals before male introduction (left) and after male removal (right). Top: no ejaculation. Bottom: with ejaculation.
(W and X) Frequency (W) and magnitude (X) of spontaneous Ca2+ transients.
Data are mean ± s.e.m. (E, F, I-K, M2-Q2, M3-Q3, S4) One-way ANOVA with repeated measures, followed by Tukey’s multiple comparisons test. (L) Two-way ANOVA, followed by Tukey’s multiple comparisons test, red and blue dots indicate periods when accumulated time differed significantly (p<0.05) between E and D vs. L and D, respectively. (T2) Two-tailed paired t test. (W, X) Two-way ANOVA, followed by Sidak’s multiple comparisons test. *p<0.05; **p<0.01; ***p<0.001.
n = number of animals. (D-Q3) n=9 estrous, 9 diestrous and 7 lactating females. (S) n=9 estrous females. (T2) n=5 females. (W-X) n=7 estrous females.
See also Figures S12–S15.
