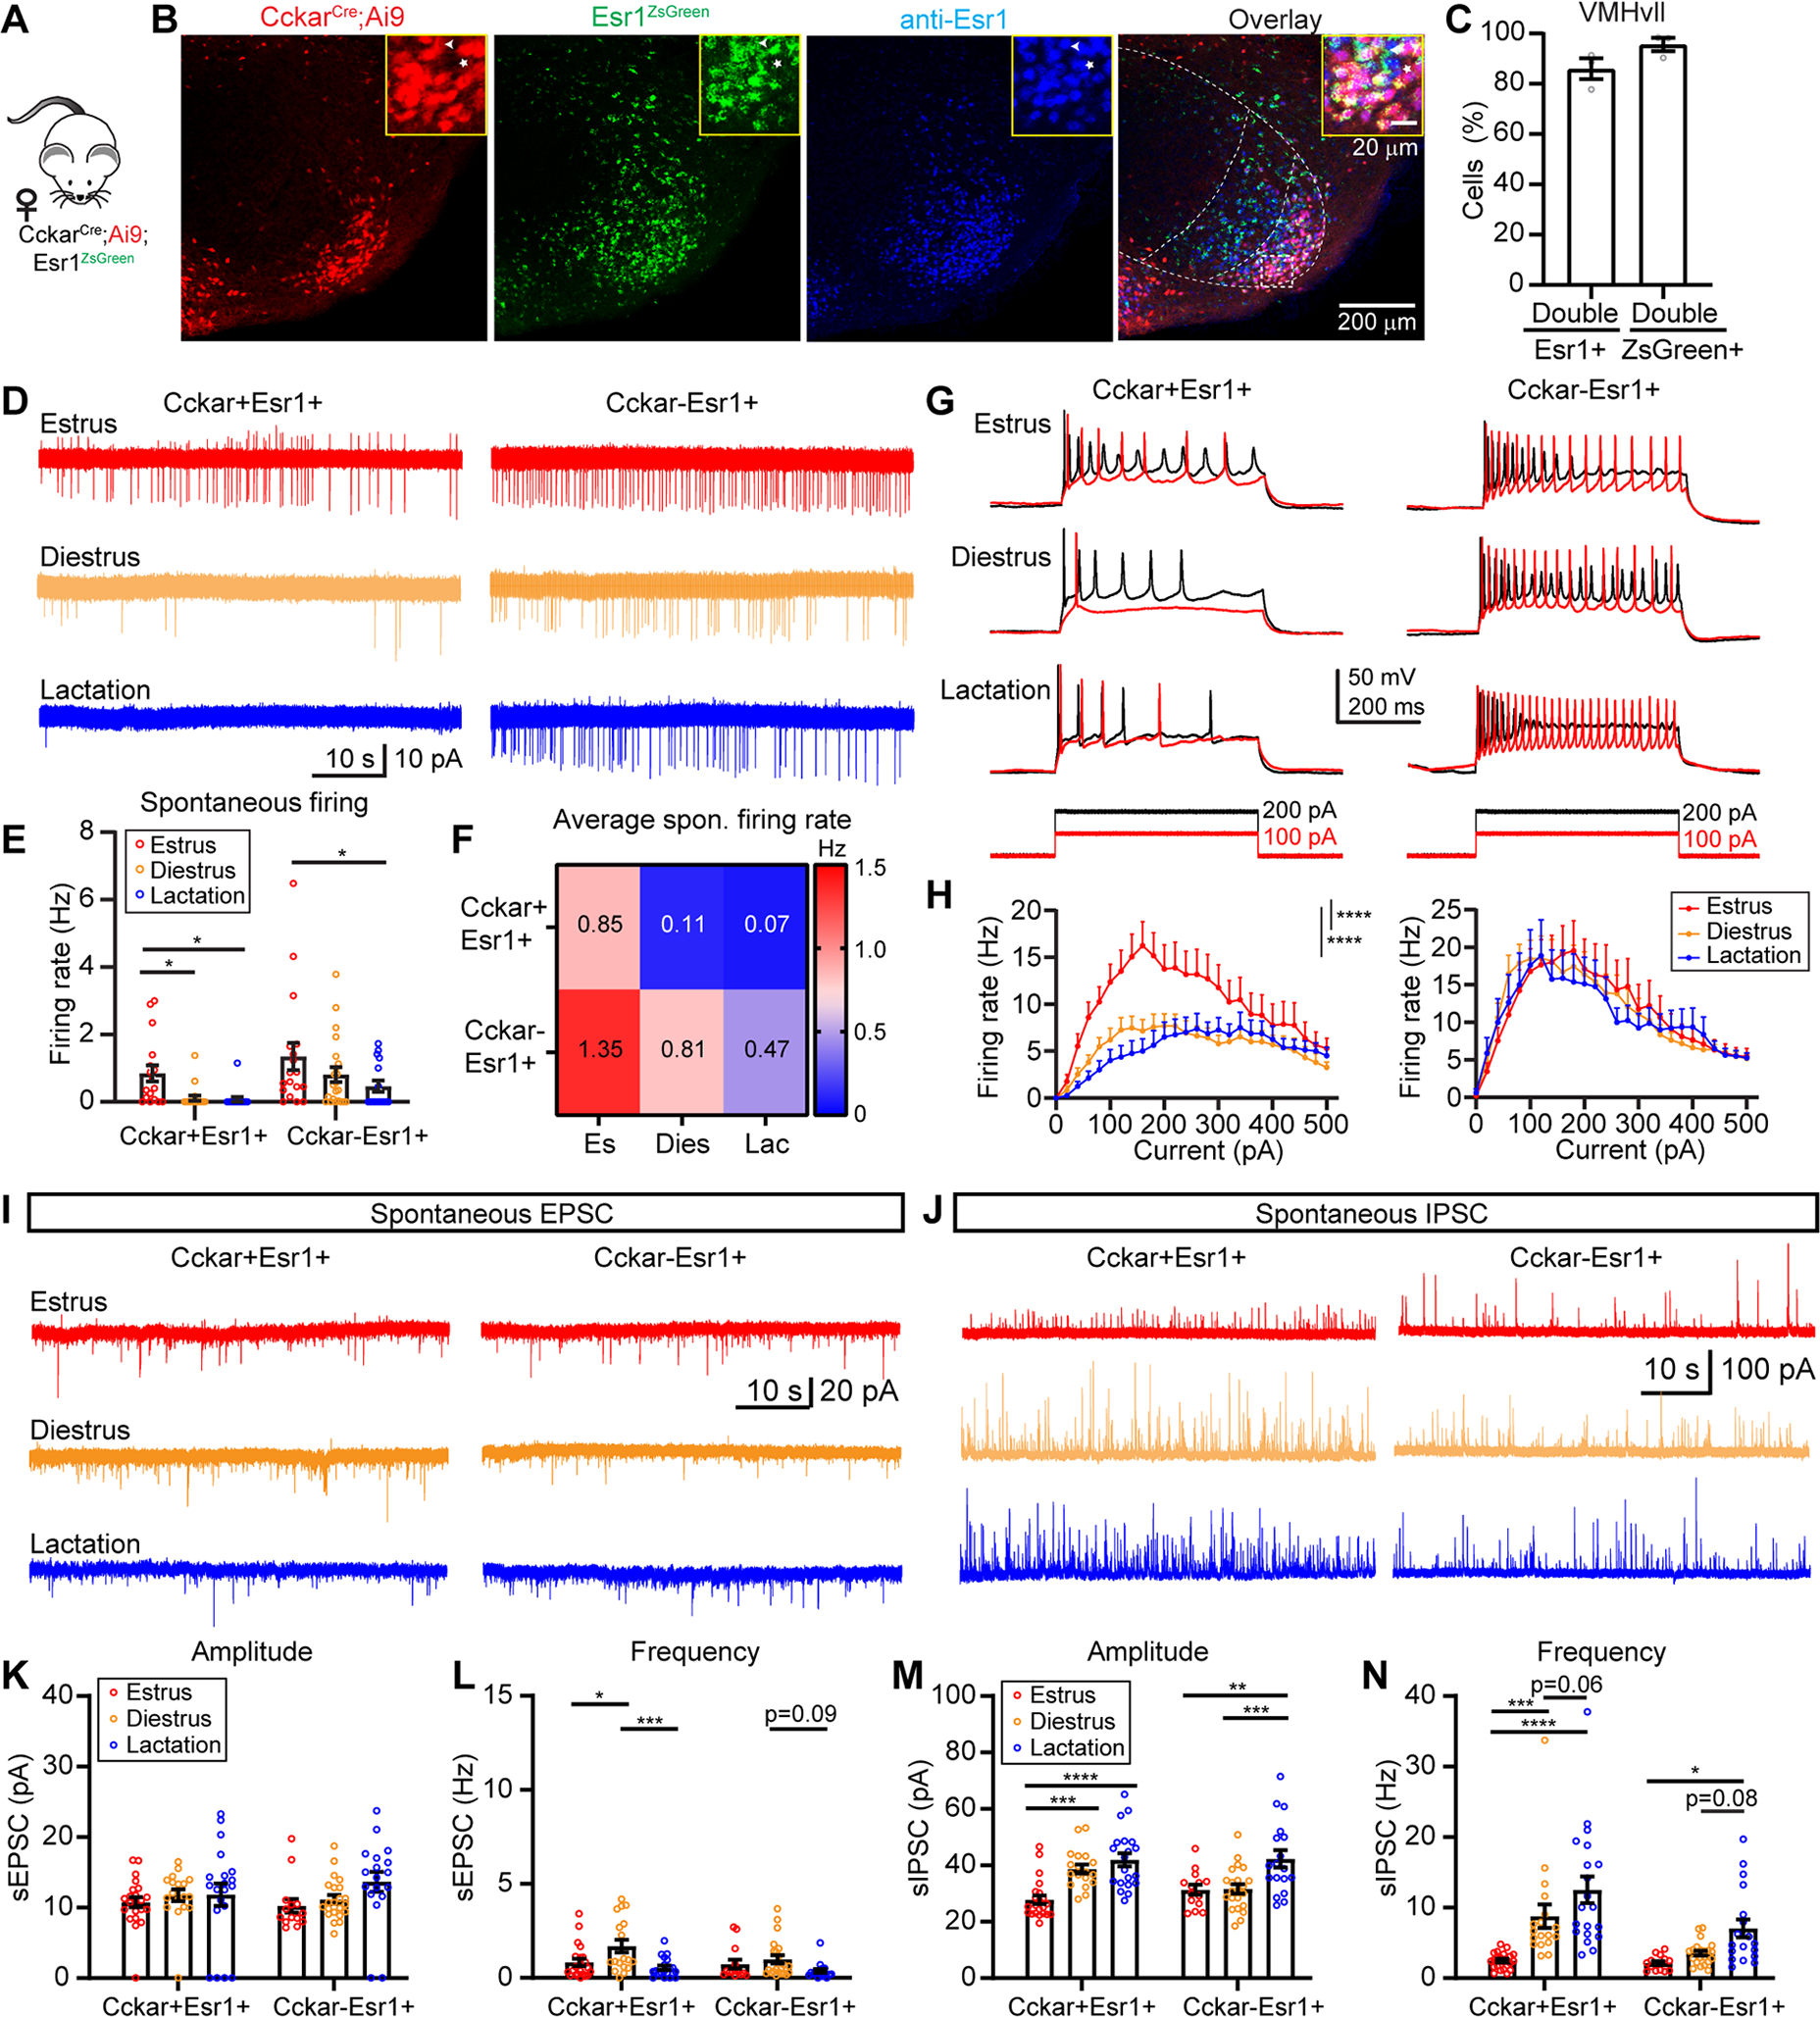
Figure 8. VMHvllCckar cells change physiological properties over reproductive cycle.

(A) Mice used for slice recording.
(B) Left to right showing tdTomato+, Cckar, ZsGreen, anti-Esr1 and overlay of all signals in the VMHvl. Dotted lines demarcate VMH. Inset, magnified region of the boxed area.
(C) Percentage of overlap between Esr1 and ZsGreen.
(D) Representative traces of cell-attached recording of VMHvllCckar+Esr1+ and VMHvllCckar−Esr1+ cells.
(E-F) Bar plots (E) and heatmap (F) showing the spontaneous firing rate under three reproductive states.
(G) Representative recording traces with 100 pA and 200 pA current injections.
(H) F-I curves of female VMHvllCckar+Esr1+ (left) and VMHvllCckar−Esr1+ cells (right).
(I-J) Representative traces of spontaneous EPSCs (I) and IPSCs (J).
(K, L, M, N) Amplitude and frequency of sEPSC (K and L) and sIPSC (M and N).
Data are mean ± s.e.m. (E, H, K-N) Two-way ANOVA followed by Tukey’s multiple comparisons test. *p<0.05; **p<0.01; ***p<0.001; ****p<0.0001.
n = number of animals. (C) n=3 animals. (E-H) 17, 19, 16 VMHvllCckar+Esr1+ cells and 18, 22, 16 VMHvllCckar−Esr1+ cells from 3 females of each reproductive state. (K-N) 22, 18, 20 VMHvllCckar+Esr1+ cells and 14, 22, 18 VMHvllCckar−Esr1+ cells from 3 females of each reproductive state.
See also Figure S16.
