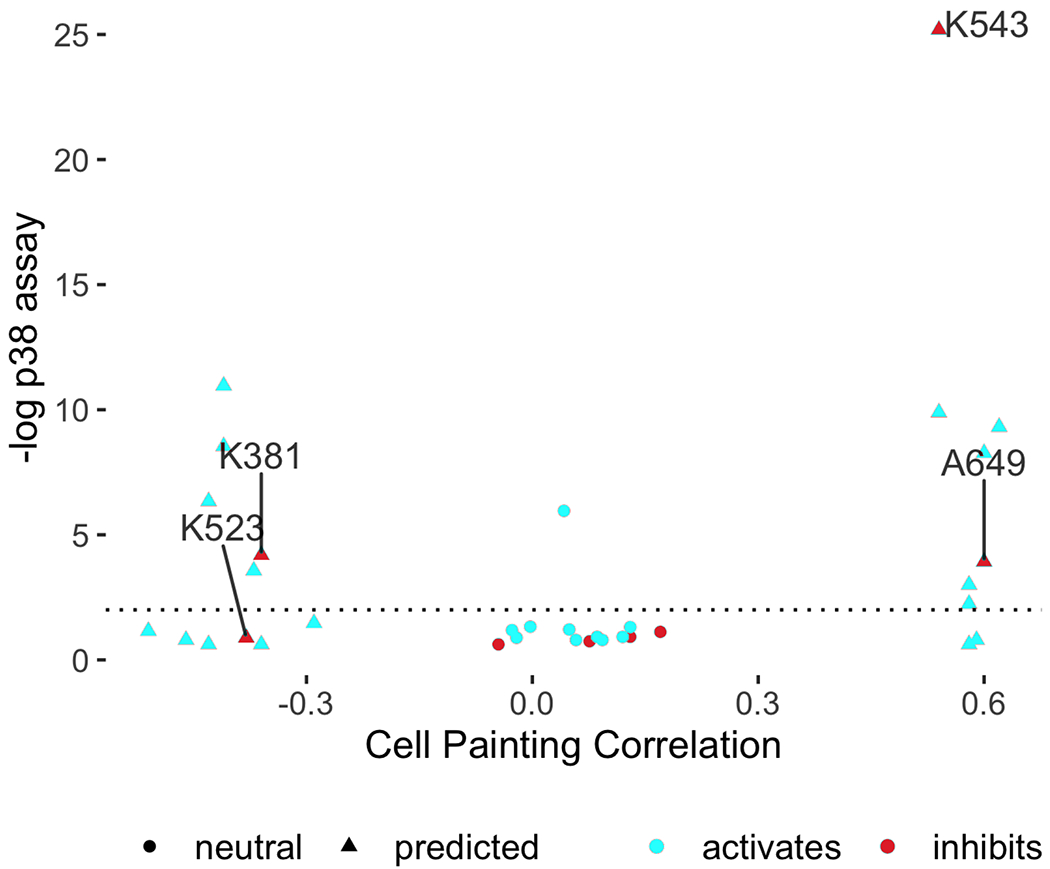
Figure 2: Cell Painting profiles identify compounds impacting the p38 pathway.

Compounds predicted to perturb p38 activity (triangles) and a set of 14 neutral compounds (Cell Painting profile correlations to p38α between −0.2 to 0.2; circles) were tested for their influence on p38 activity at 1 μM using a two-sided t-test on the single cell distributions of a p38 activity reporter (Kaufman et al., 2020) (FDR-adjusted −log10 p-values shown). Two potential inhibitors were found (BRD-K38197229 <K381> and BRD-A64933752 <A649>); an additional one (BRD-K52394958 <K523>) was identified via an alternative statistical test (Supplementary Figure S8a, h–i). K543 (BRD-K54330070) denotes SB-202190, a known p38 inhibitor found as a match (other known inhibitors such as SB-203580 from Figure 1 were strong matches but excluded from this experiment because they were already known). The x-axis reports the Pearson correlation between the average Cell Painting profile of the compound with the average Cell Painting profile of MAPK14 overexpression, where the averages are computed across five replicates for MAPK14, eight replicates for bioactive compounds, and four replicates for diversity-oriented synthesis (DOS) compounds. The y-axis reports the average FDR-adjusted −log10 p-values across four replicates.
