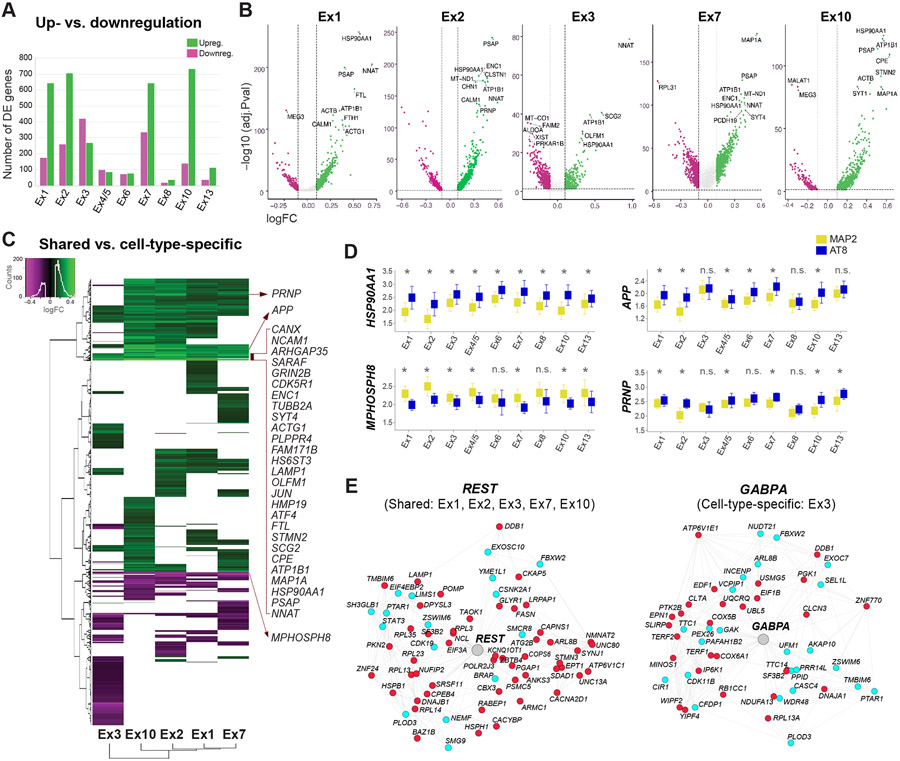
Figure 4. Transcriptomic signatures of tau pathology within and across neuronal subtypes.
(A) Total numbers of up- and downregulated genes between neurons with and without NFTs.
(B) Volcano plots of DE genes for five excitatory subtypes with high NFT proportions. Dots represent genes (green = upregulated; magenta = downregulated). Dashed lines indicate significance thresholds (log-fold change <0.1 or > 0.1; adjusted p-value < 0.05; for genes detected in ≥ 20% of cells in at least one condition; MAST test). Top 10 DE genes are displayed.
(C) Heatmap and hierarchical clustering of DE genes highlighting shared and cell-type-specific up- and downregulated genes. Input lists of genes were truncated to match the cell type with the smallest number of DE genes. The genes listed include shared DE genes with the highest log-fold change values.
(D) Box plots showing median expression values of HSP90AA1, APP, PRNP, and the epigenetic repressor MPHOSPH8 in neurons with and without NFTs in each cluster. *p < 0.05 (MAST test); n.s. = not significant.
(E) REST and GABPA transcriptional regulatory networks (color code: cyan = genes coregulated and coexpressed based on our single-cell data and/or ROSMAP datasets; red = genes coregulated, coexpressed, and differentially expressed in neurons with NFTs).

