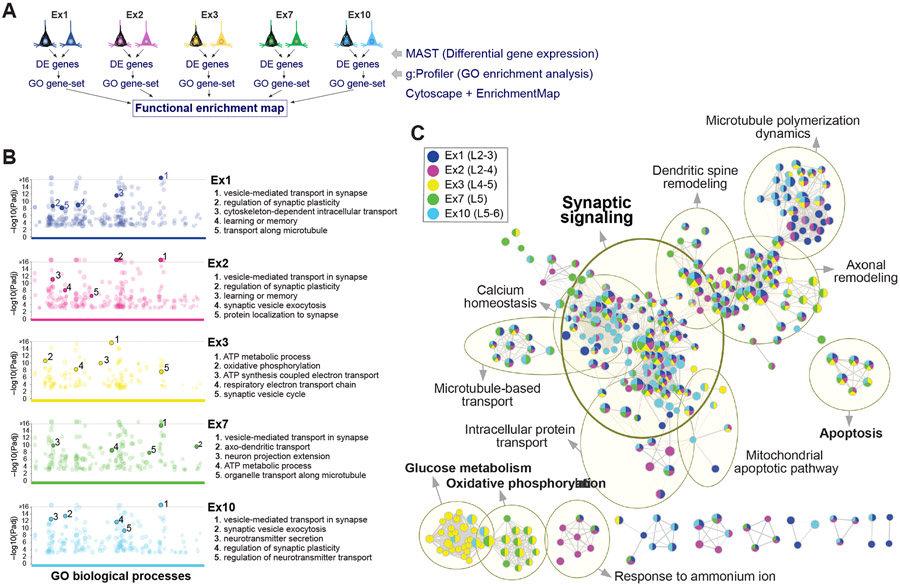
Figure 5. Shared versus cell-type-specific pathways associated with tau pathology.
(A) Overview of strategy to identify shared and cell-type-specific pathways overrepresented in the five clusters with highest cell numbers and NFT proportions.
(B) Manhattan plots of GO biological processes enriched in NFT-bearing vs. NFT-free neurons for each cluster, obtained using g:Profiler. Colored circles represent significant terms (thresholds: g:SCS significance < 0.001; GO terms with > 50 or < 500 genes; capped at terms with a −log10 [Padj] > 16). Top 5 nonredundant terms are highlighted.
(C) Functional enrichment map. Nodes represent gene sets of GO biological processes; each node is color-coded by cluster to illustrate shared and cell-type-specific contributions. Yellow circles delineate constellations of functionally related gene sets.
See also Table S4.

