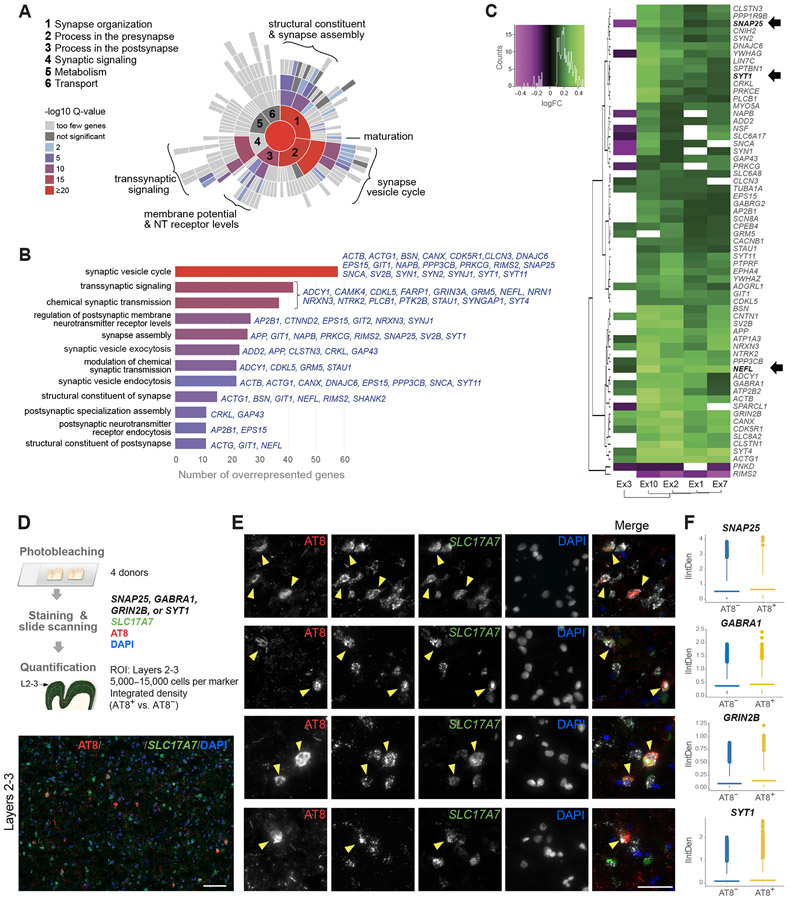
Figure 6. Dysregulation of synaptic transmission pathways in NFT-bearing neurons.
(A and B) Enrichment of synaptic transmission pathways in NFT-bearing neurons by SynGO. Sunburst plot illustrates over- and underrepresented biological process terms; colors represent enrichment values at 1% FDR. The bar plot highlights top 12 enriched terms and commonly DE genes in NFT-bearing neurons within each term.
(C) Heatmap and hierarchical clustering of 63 synaptic genes dysregulated across five excitatory subtypes (green = upregulated; magenta = downregulated; MAST test with adjusted p-value < 0.05; log-fold change >0.1; detection in ≥ 20% of cells). Arrows indicate genes for known biomarkers.
(D) Experimental design to validate upregulation of synaptic markers in AT8+ excitatory neurons. Representative section illustrates AT8 and GRIN2B colocalization in layers 2–3 SLC17A7+ neurons (arrowheads).
(E) Representative double fluorescent ISH staining for SLC17A7 and either SNAP25, GABRA1, GRIN2B, or SYT1 in AT8+ neurons (arrowheads).
(F) Quantification of integrated density (IntDen) of SNAP25, GABRA1, GRIN2B, or SYT1 in AT8+ vs. AT8− excitatory neurons. Average expression in AT8+ vs. AT8− neurons for each donor was significantly increased for 3 of the 4 markers (paired t-test; n = 4 donors; p = 0.11 [SNAP25], p = 0.05 [GABRA1], p = 0.02 [GRIN2B], p = 0.04 [SYT1]). After fitting a linear mixed model to predict IntDen with AT8, using the donor as a random effect, the effect of AT8 was statistically significant and positive (p < 0.001) for all markers.

