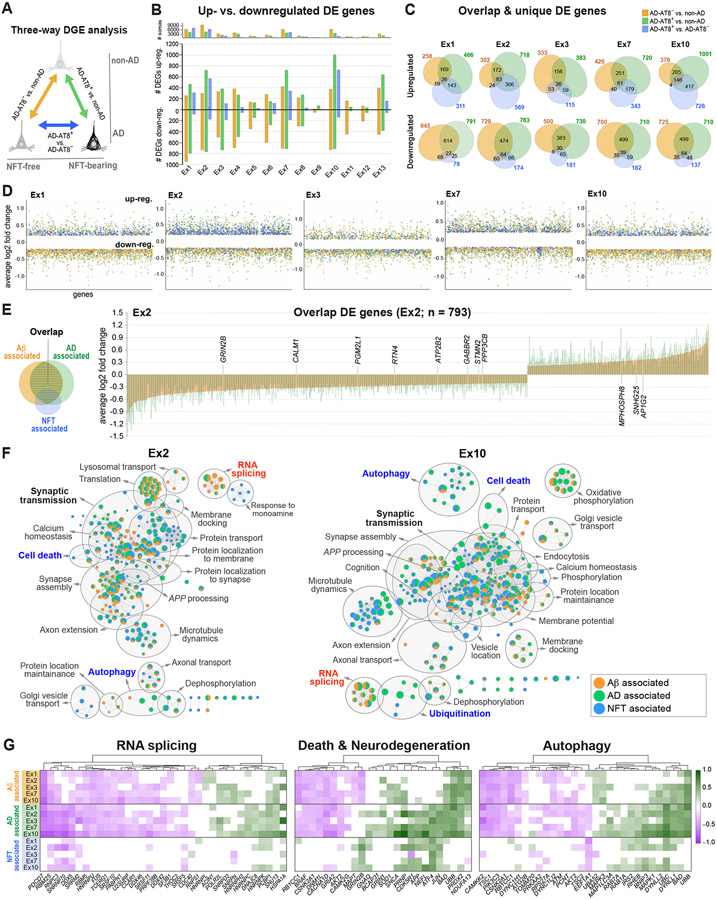
Figure 8. NFT-associated versus AD-associated transcriptomic changes in AD.
(A) Three-way DGE analysis between non-AD, AD-AT8−, and AD-AT8+ datasets; colors represent DGE between each pair.
(B) Bar chart showing the total number of up- and downregulated genes for each comparison within each excitatory subtype.
(C) Venn diagrams showing the number of overlapping and unique DE genes for each comparison in five excitatory subtypes susceptible to tau aggregation.
(D) Scatter plots illustrating the distribution of up- and downregulated genes.
(E) Bar plot showing average log2 fold change values for overlap genes in a representative vulnerable subtype (Ex2). Each bar represents a DE gene (n = 793). The bars are overlaid (orange = AD-AT8− vs. non-AD; green = AD-AT8+ vs. non-AD) to demonstrate the directionality and log2 fold change per gene for the two comparisons. Only the 11 genes named in the figure were dysregulated in opposite directions.
(F) Functional enrichment maps illustrating Aβ-associated, NFT-associated, and AD-associated terms. Nodes represent gene sets of GO biological processes. Gray circles delineate constellations of functionally related gene sets.
(G) Heatmaps of DE genes within the RNA splicing, death, and autophagy pathways highlighting Aβ-associated, NFT-associated, and AD-associated genes (green = upregulated; magenta = downregulated; MAST test with adjusted p-value < 0.05; log2 fold change >0.1; detection in ≥ 20% of cells).

