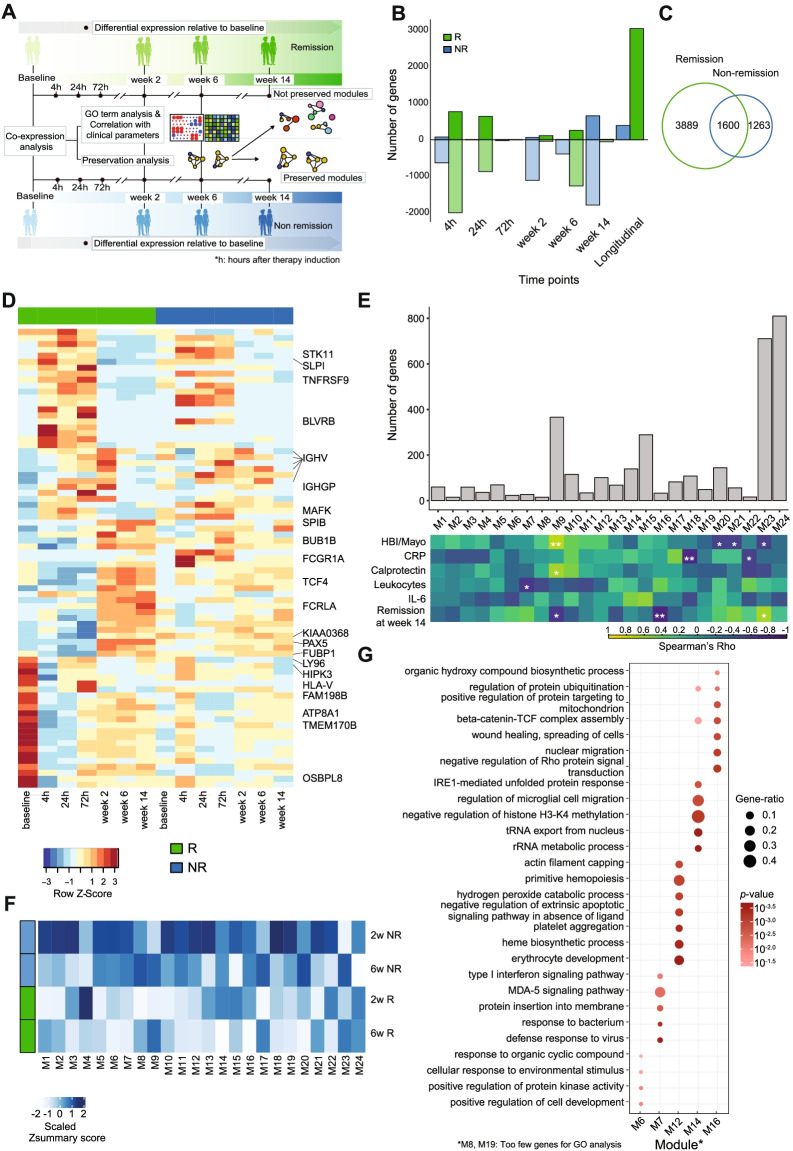
Fig. 2.
Dynamic changes in transcription in response to therapy induction and remission. A Schematic workflow. B Number of upregulated (dark) and downregulated (light) genes in remission (green) and non-remission (blue) patients at each time point after therapy induction obtained from the pairwise analysis and number of transiently differentially expressed genes obtained from the longitudinal analysis of the discovery cohort. Negative numbers are used to show the number of downregulated genes. C Venn diagram showing the number of DEGs in remission and non-remission patients from pairwise and longitudinal analysis combined. D Heatmap of top DEGs in remission patients from pairwise and longitudinal analysis, showing scaled mean expression counts at each time point in remission and non-remission samples. Selected immune-relevant transcripts are labeled by gene name. E Bar plot showing the number of genes in each co-expression module along with a correlation heatmap showing Spearman’s rank correlation coefficients between gene co-expression modules (columns) and clinical parameters (rows). *p-value < 0.05, **p-value < 0.01, and ***p-value < 0.001 in Spearman’s correlation. Color intensity corresponds to the correlation coefficient. F Heatmap showing Zsummary scores of baseline co-expression modules in remission and non-remission samples at weeks 2 and 6. G GO terms enriched in differentially preserved co-expression modules between remission and non-remission. Dot size is proportional to the gene ratio and color corresponds to the p-value of enrichment

