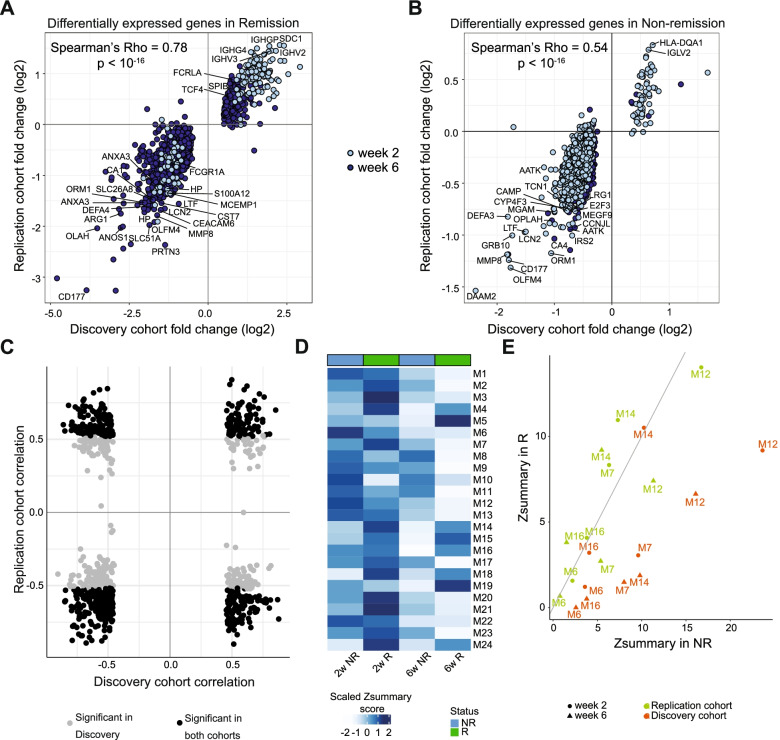
Fig. 5.
Replication of molecular signatures. A, B Comparison of log fold change of DEGs in remission (A) and non-remission (B) patients at weeks 2 (light blue) and 6 (dark blue) between discovery and replication cohorts. C Comparison of DEG-DMP correlation between discovery and replication cohorts. Gray dots represent a significant correlation in the discovery cohort while black dots significant correlation in both cohorts. D Heatmap showing Zsummary scores of baseline co-expression modules from the discovery cohort in remission (green) and non-remission (blue) samples at weeks 2 and 6 of the replication cohort. E Comparison of Zsummary scores of differentially preserved modules in discovery cohort between remission and non-remission samples at weeks 2 (circle) and 6 (triangle) in the discovery (orange) and replication (green) cohorts

