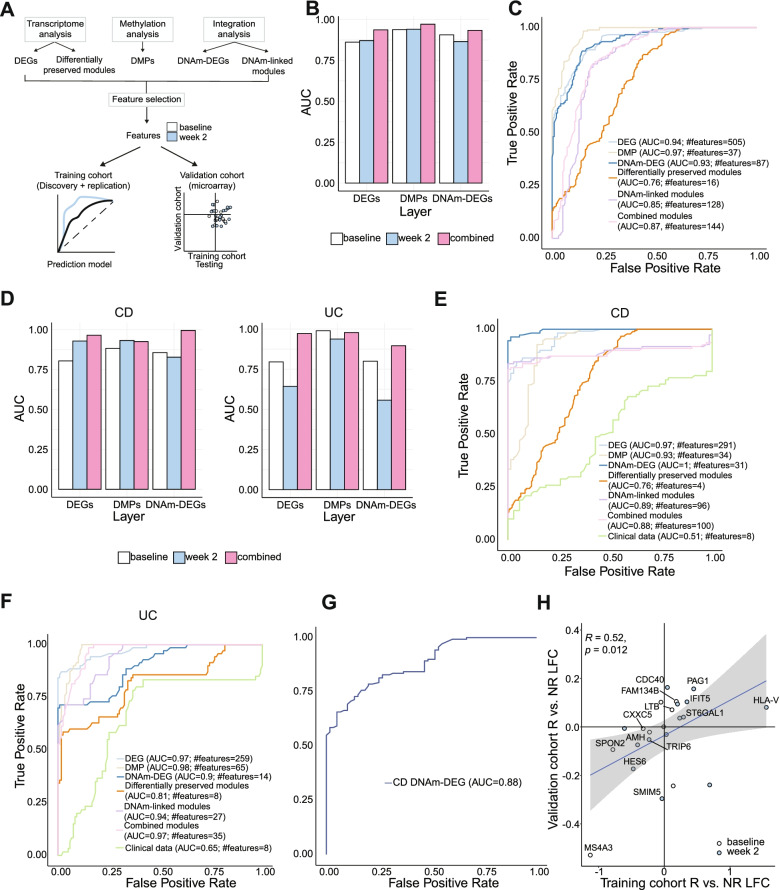
Fig. 6.
Feature selection and validation of molecular signatures. A Schematic workflow. B, D Comparison of AUC values of the ROC curves of prediction models constructed using selected baseline (white), week 2 (blue), and combined (pink) features from DEGs, DMPs, and DNAm-DEGs using a random forest approach in IBD (B), CD, and UC (D) samples from the training cohort. C, E, F ROC curves of prediction models constructed using selected features (baseline and week 2 combined) from DEGs, DMPs, DNAm-DEGs, differentially preserved, DNAm-linked, combined modules, and clinical parameters using a random forest approach in IBD (C), CD (E), and UC (F) samples from the training cohort. G ROC curve of prediction model constructed using selected features from DNAm-DEGs in the validation cohort. H Comparison of log fold change between remitters and non-remitters at baseline (white) and week 2 (blue) (left) between training cohort and validation cohorts

