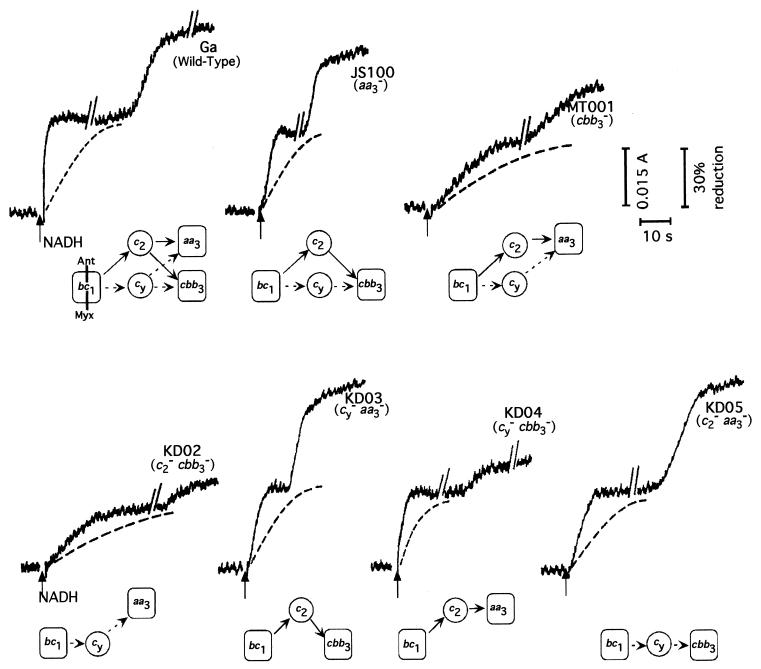
FIG. 5.
Cyt c reduction kinetics in R. sphaeroides wild-type strain Ga and various mutants. Cyt c reduction kinetics were monitored at 551 to 540 nm using membrane fragments of various mutants as described in Materials and Methods. In all experiments, the first reduction wave was initiated by addition of 0.2 mM NADH at the time indicated by the arrow, while the second reduction wave followed the onset of anaerobiosis the time of which was dependent on the rate of oxygen consumption. Dashed traces represent cyt c reduction patterns observed upon addition of Ant A or Myx (2 μM each) before the addition of NADH. Protein concentrations of membrane fragments used were 0.8 mg/ml and 2 to 3 mg/ml for the wild-type strain Ga and its mutant derivatives, respectively. Below the traces, schemes depicting the available electron transport pathways are shown.

