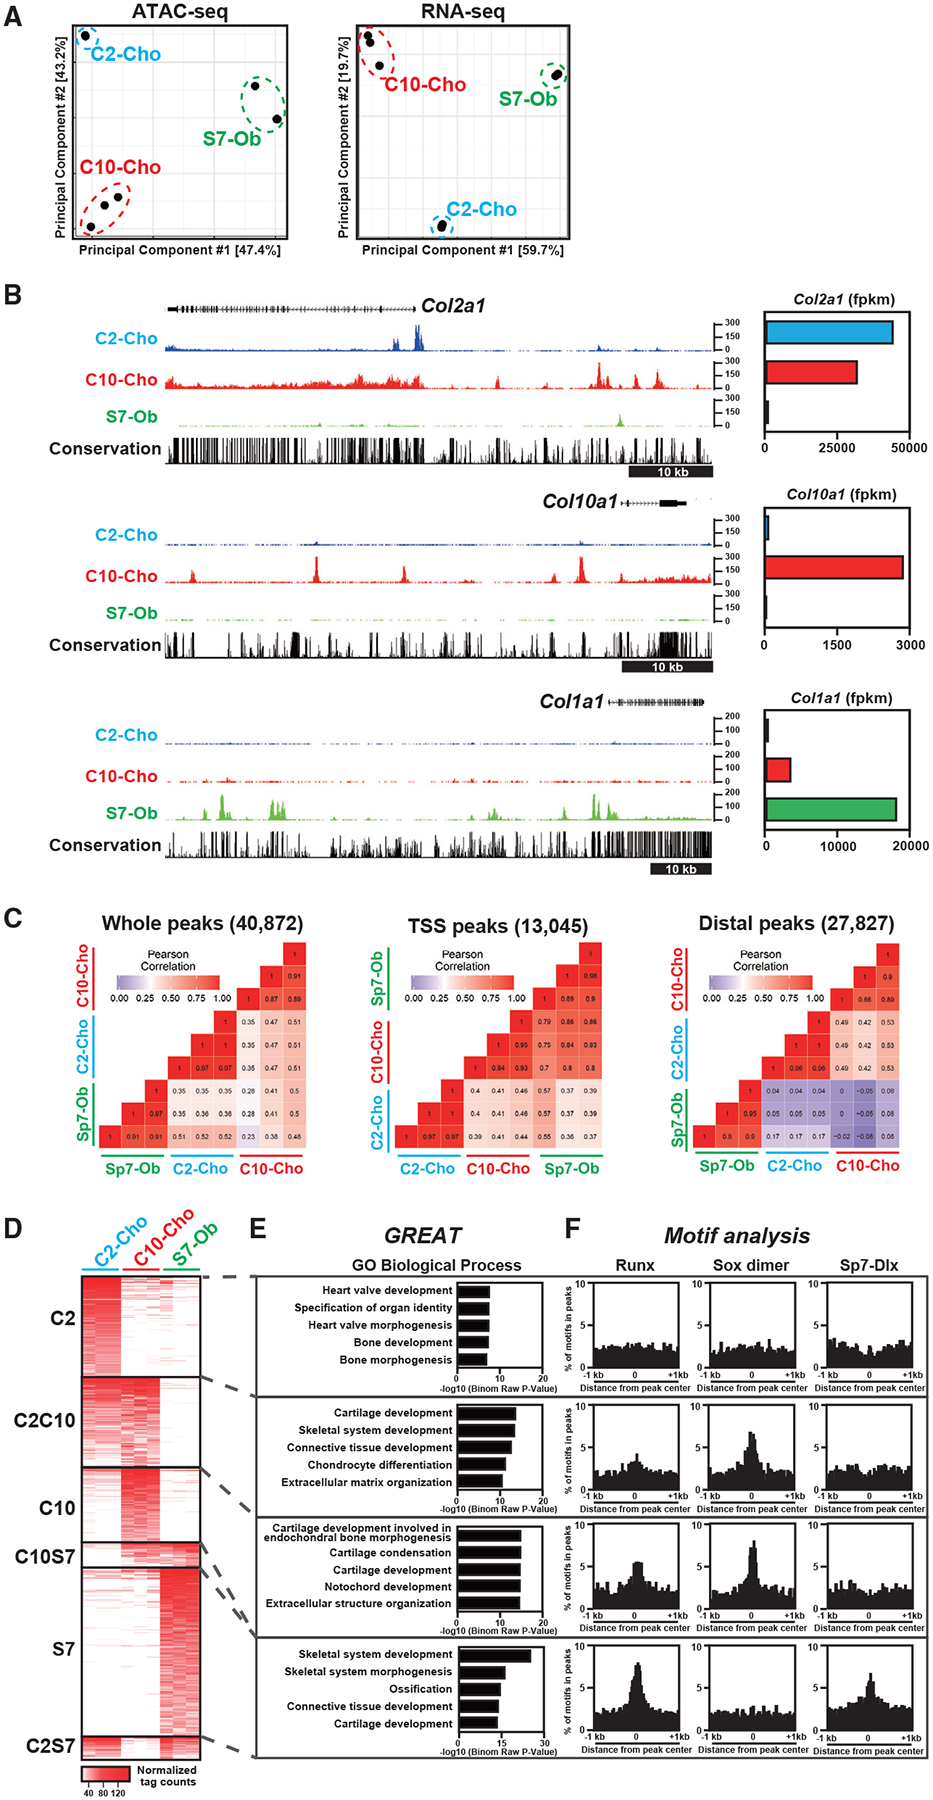
Figure 1. Identification of cell-type-distinct chromatin accessibility in neonatal chondrocytes and osteoblasts.

(A) Principal-component analysis (PCA) of ATAC-seq and RNA-seq data. C2-Cho, Col2a1-ECFP-sorted rib chondrocytes; C10-Cho, Col10a1-mCherry-sorted rib chondrocytes; S7-Ob, Sp7-EGFP-sorted calvaria osteoblasts.
(B) CisGenome browser screenshots showing chromatin accessibility around skeletal marker genes (left) and the corresponding gene expression in skeletal cell types (right). Representative data (left) and average of normalized values (right) from biological triplicates are shown.
(C) Correlation analysis of ATAC-seq profiles of the three skeletal cell types. The color indicator represents the Pearson correlation coefficient. TSS peaks, peaks located within 500 bp from the transcription start site (TSS) of the nearest genes; distal peaks, peaks located more than 500 bp from the TSS.
(D) Heatmap showing chromatin accessibility in the cell-type-distinct regions. C2, C2-Cho-distinct peaks; C10, C10-Cho-distinct peaks; S7. S7-Ob-distinct peaks; C2C10, peaks with high intensity in C2-Cho and C10-Cho but not S7-Ob; C10S7, peaks with high intensity in C10-Cho and S7-Ob but not C2-Cho; C2S7, peaks with high intensity in C2-Cho and S7-Ob but not C10-Cho. The Color indicator represents the normalized ATAC-seq peak intensity.
(E) GREAT Gene Ontology (GO) annotations of identified chromatin-accessible regions. The top five enriched terms are shown in each group.
(F) Enrichment of Runx, Sox dimer, and Sp7-Dlx consensus motifs in the identified chromatin-accessible regions in the 2-kb window from the center of the ATAC-seq peaks.
Profiles of biological triplicates were used (A, C, and D). See also Figure S1 and Tables S1 and S2.
