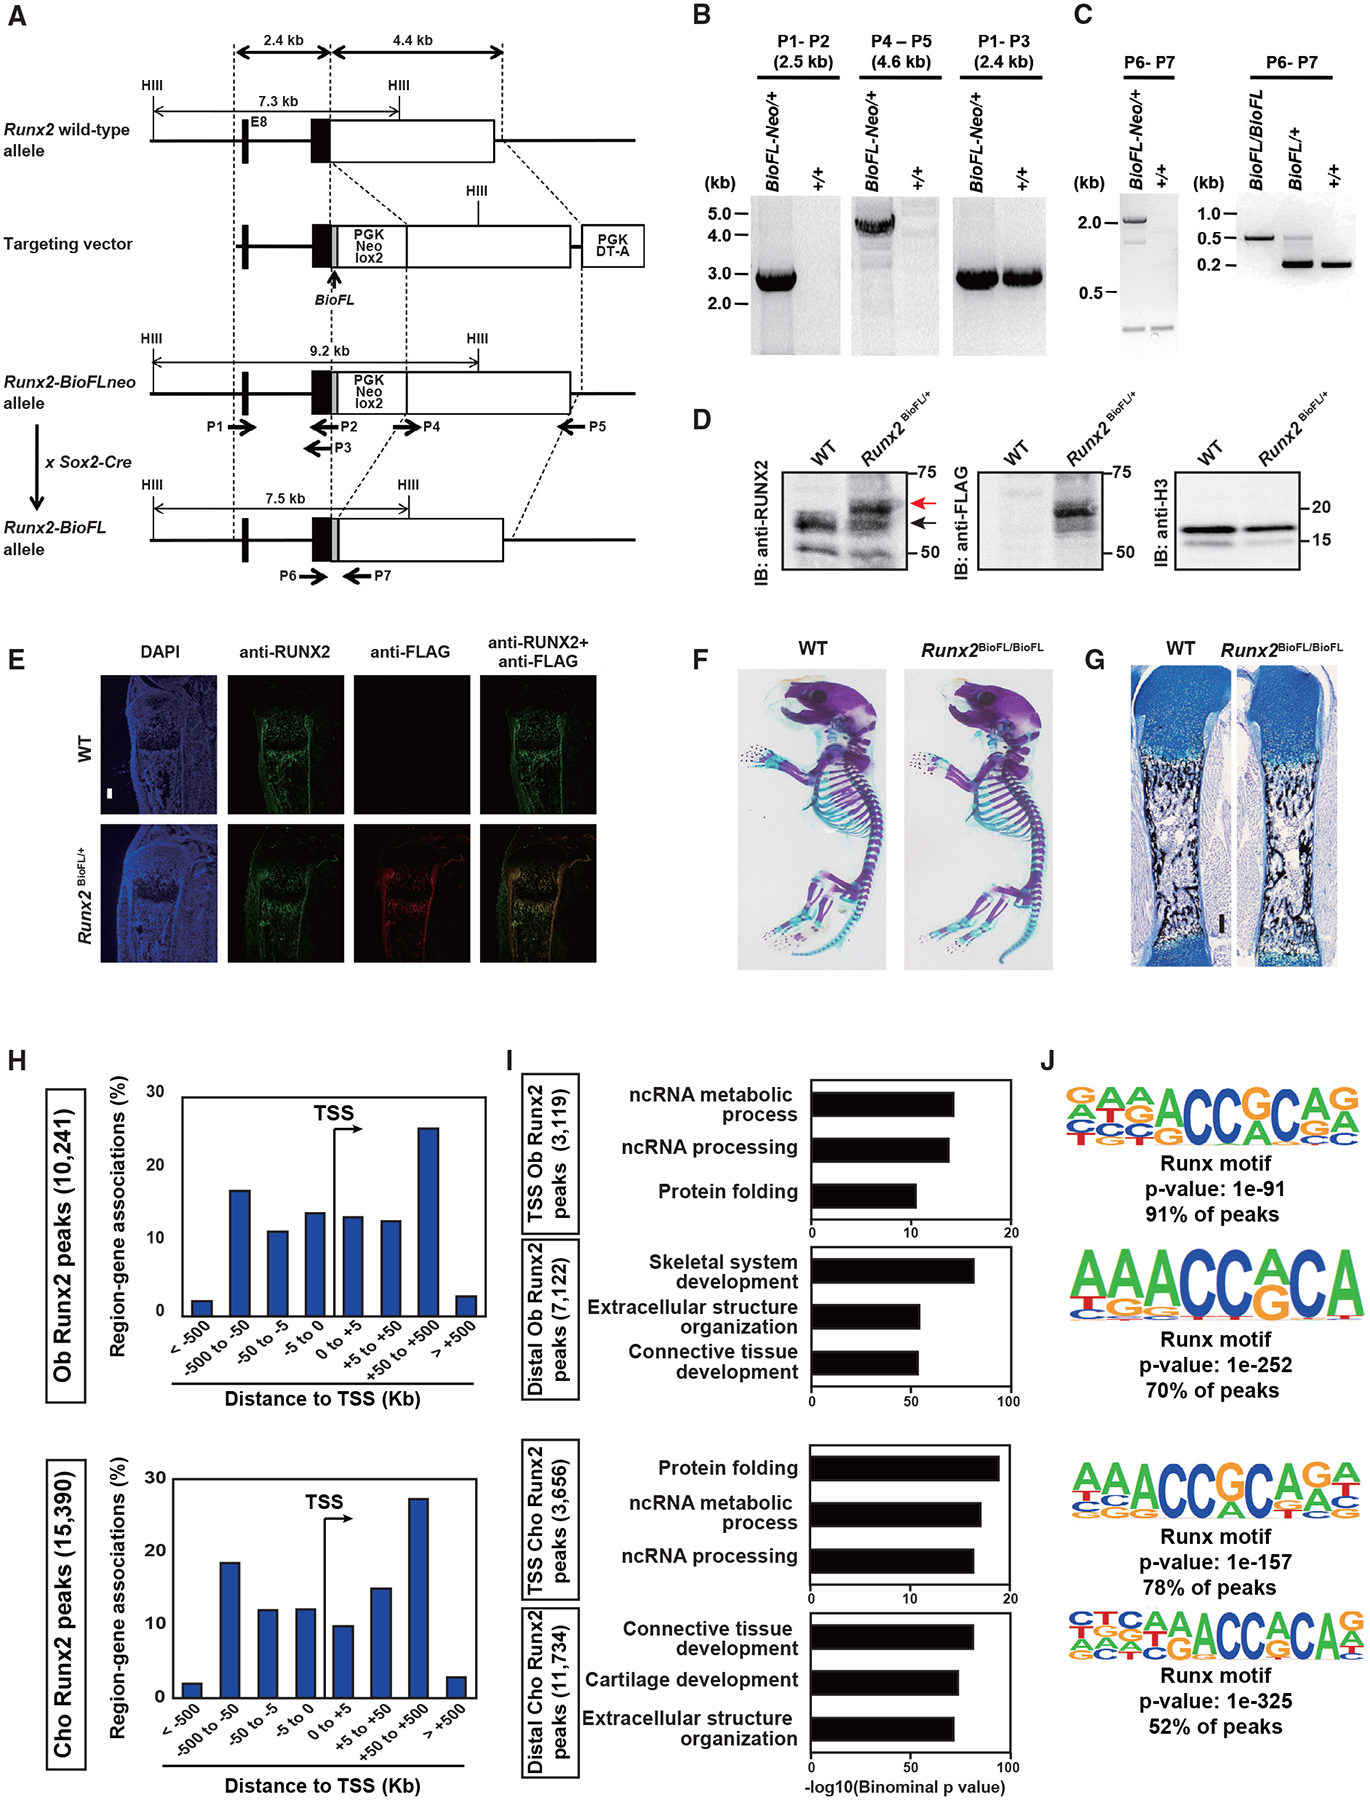
Figure 2. Generation of a Runx2 Bio-3xFL knockin mouse line and Runx2 association profiles in osteoblasts and chondrocytes.

(A) Targeting strategy for the Runx2 Bio-3xFL knockin allele.
(B) Long-range PCR analysis of the Runx2 knockin allele using the primers in (A).
(C) PCR genotyping of Runx2-BioFLneo and Runx2-BioFL mice obtained by crossing Runx2-BioFLneo mice to Sox2-Cre mice; see (A).
(D) Western blot comparison of Runx2 and Runx2-BioFL proteins in primary osteoblasts derived from neonatal calvarial cells. Cells were cultured in an osteogenic medium for 7 days. Red arrow, Runx2-BioFL; black arrow, Runx2. Blotting for histone H3 (H3) was used for the control.
(E) Immunohistochemistry for Runx2 and FL tag detection in tibial sections of P1 Runx2-BioFL pups. Scale bar, 300 μm.
(F) Whole-mount skeleton of P1 pups stained with Alcian blue (cartilage) and alizarin red (mineralized tissue).
(G) Histological analysis of calcified bone matrix stained with von Kossa (black) and cartilage stained with Alcian blue in a P1 femur. Scale bar, 100 μm.
(H) Genome-wide distribution of Runx2-associated regions relative to TSSs in osteoblasts (Obs) and chondrocytes (Chos). The total number of Runx2-associated regions is indicated.
(I) GREAT GO annotations of Runx2-associated regions. The top three enriched terms are shown in each TSS and distal region.
(J) De novo motif analysis of the top 1,000 Runx2-associated regions in Obs and Chos. The p value of the shown motif and the percentage of peaks containing the enriched Runx motif are shown.
Representative images obtained from at least biological duplicates are shown (E–G). See also Table S3.
