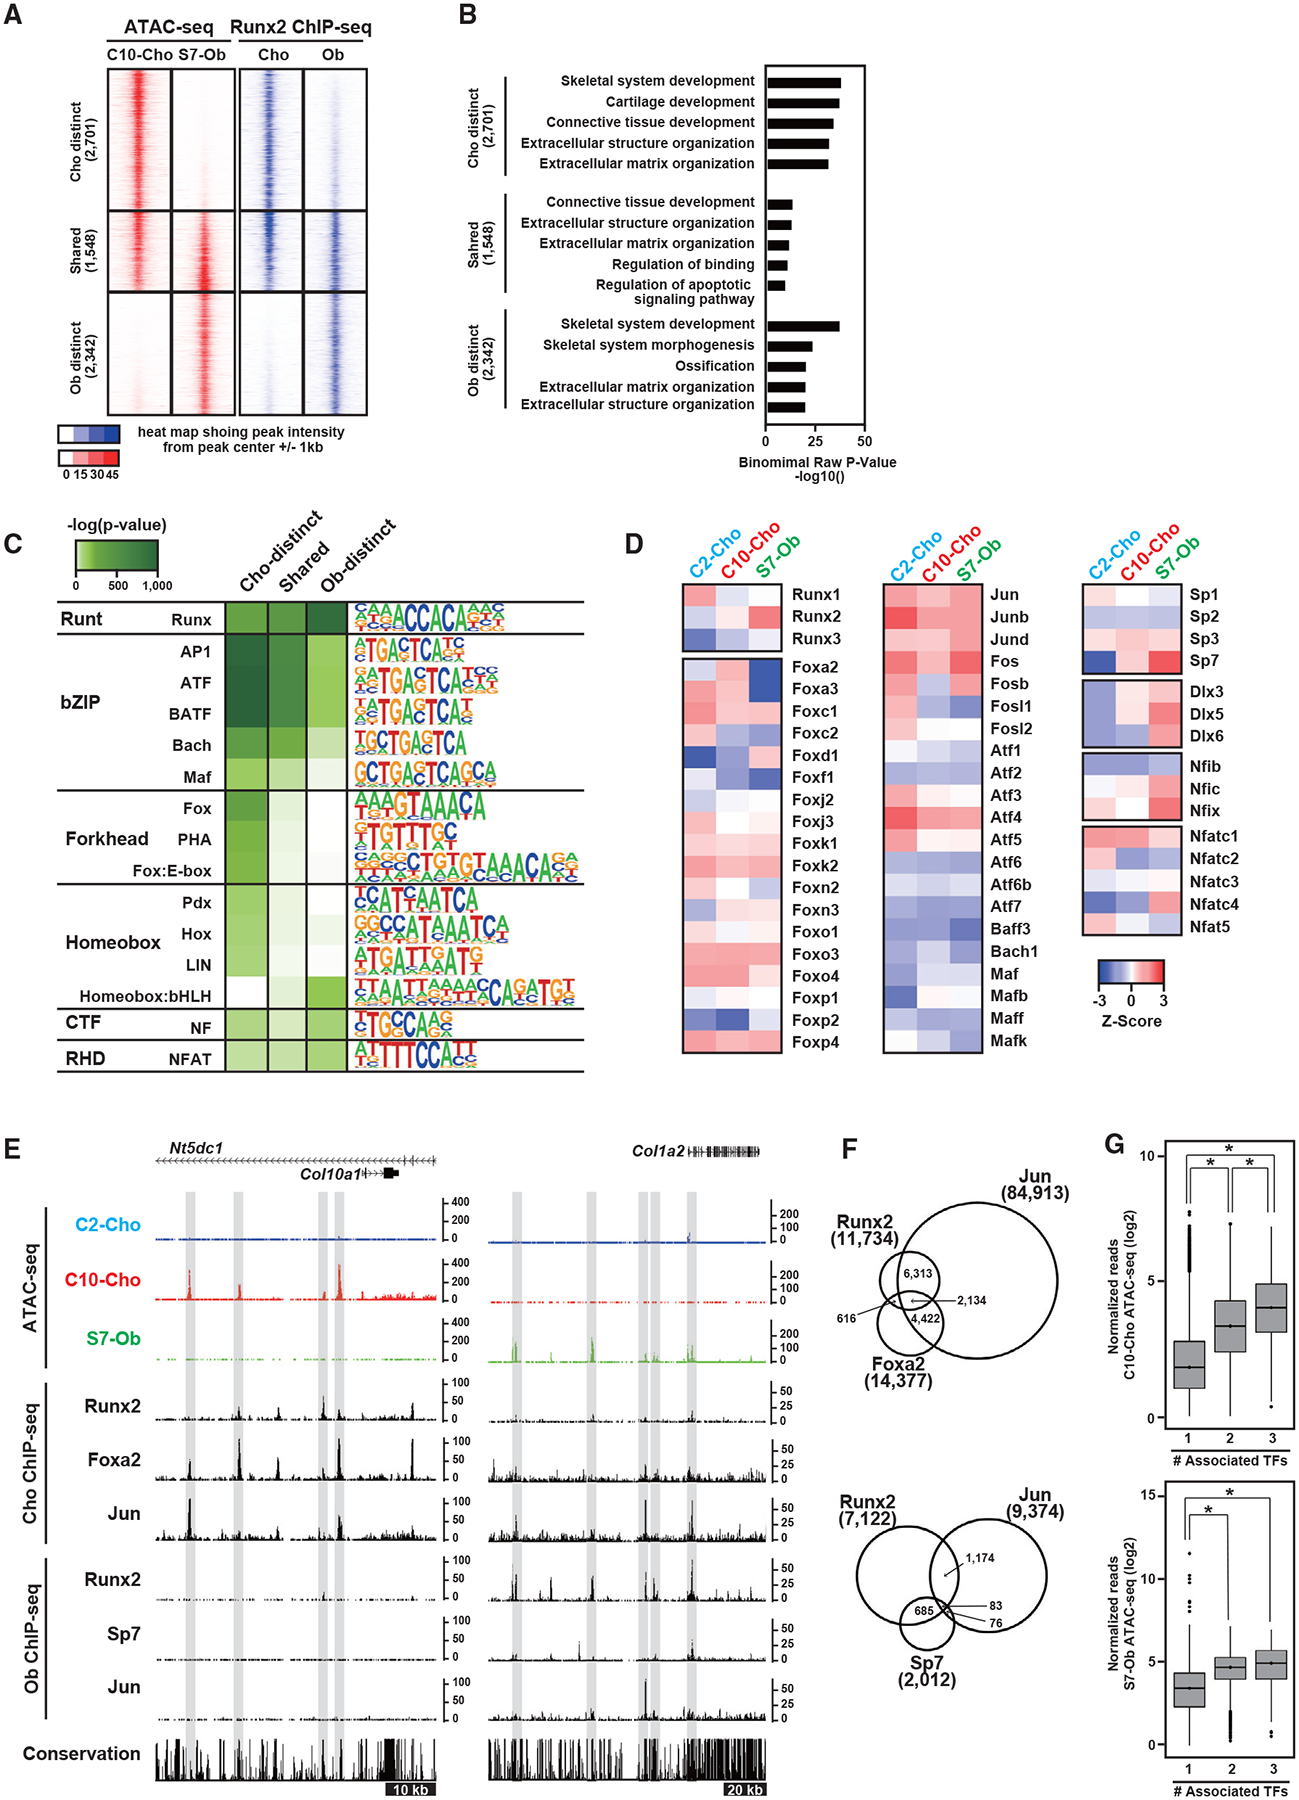
Figure 3. Actions of Runx2 and its potential interaction with other transcriptional regulators on the genome.

(A) Signal intensities of chromatin accessibility and Runx2-DNA binding in Obs and Chos. The selected regions showing Ob- and Cho-distinct signatures and their shared signatures are shown. The number of selected genomic regions is indicated. Representative data obtained from at least biological duplicates are shown.
(B) GREAT GO annotations of the selected regions, showing the top five enriched terms.
(C and D) Enrichment of motifs in Ob- and Cho-distinct regions and their shared regions. Motifs with p < 1.0 × 10−50 and target sequences with motifs >10% are shown (C). Also shown (D) is the Z score representing the relative gene expression of transcription factors in C2-Cho, C10-Cho, and S7-Ob. Genes were selected from the enriched motifs in (D). Average values obtained from biological triplicates were used. Transcription factors with fragments per kilobase of transcript per million mapped reads (FPKM) >5 are shown.
(E) CisGenome browser screenshots of the flanking regions of Col10a1 and Col1a2 showing chromatin accessibility and the associations of transcription factors in Obs and Chos. Cell-type-distinct regions are highlighted in gray.
(F) Venn diagram showing the overlap of ChIP-seq peaks. Top: Runx2, Foxa2, and Jun in Chos. Bottom: Runx2, Sp7, and Jun in Obs. ChIP-seq peaks distally located more than 500 bp from the nearest TSS were used. Peak numbers for each ChIP-seq peak are shown.
(G) Boxplots showing the normalized reads of ATAC-seq at regions associated with the indicated number of transcription factors. Top: C10-Cho ATAC-seq at regions occupied by Runx2, Foxa2, and/or Jun in Chos. Bottom: S7-Ob ATAC-seq at the regions occupied by Runx2, Sp7, and/or Jun in Obs. The y axis value is log2 (normalized reads + 1). The values were averaged from biological triplicates. *p < 0.0001 versus normalized reads with the one factor-associated site (Tukey-HSD analysis).
See also Figures S2 and S3 and Table S4.
