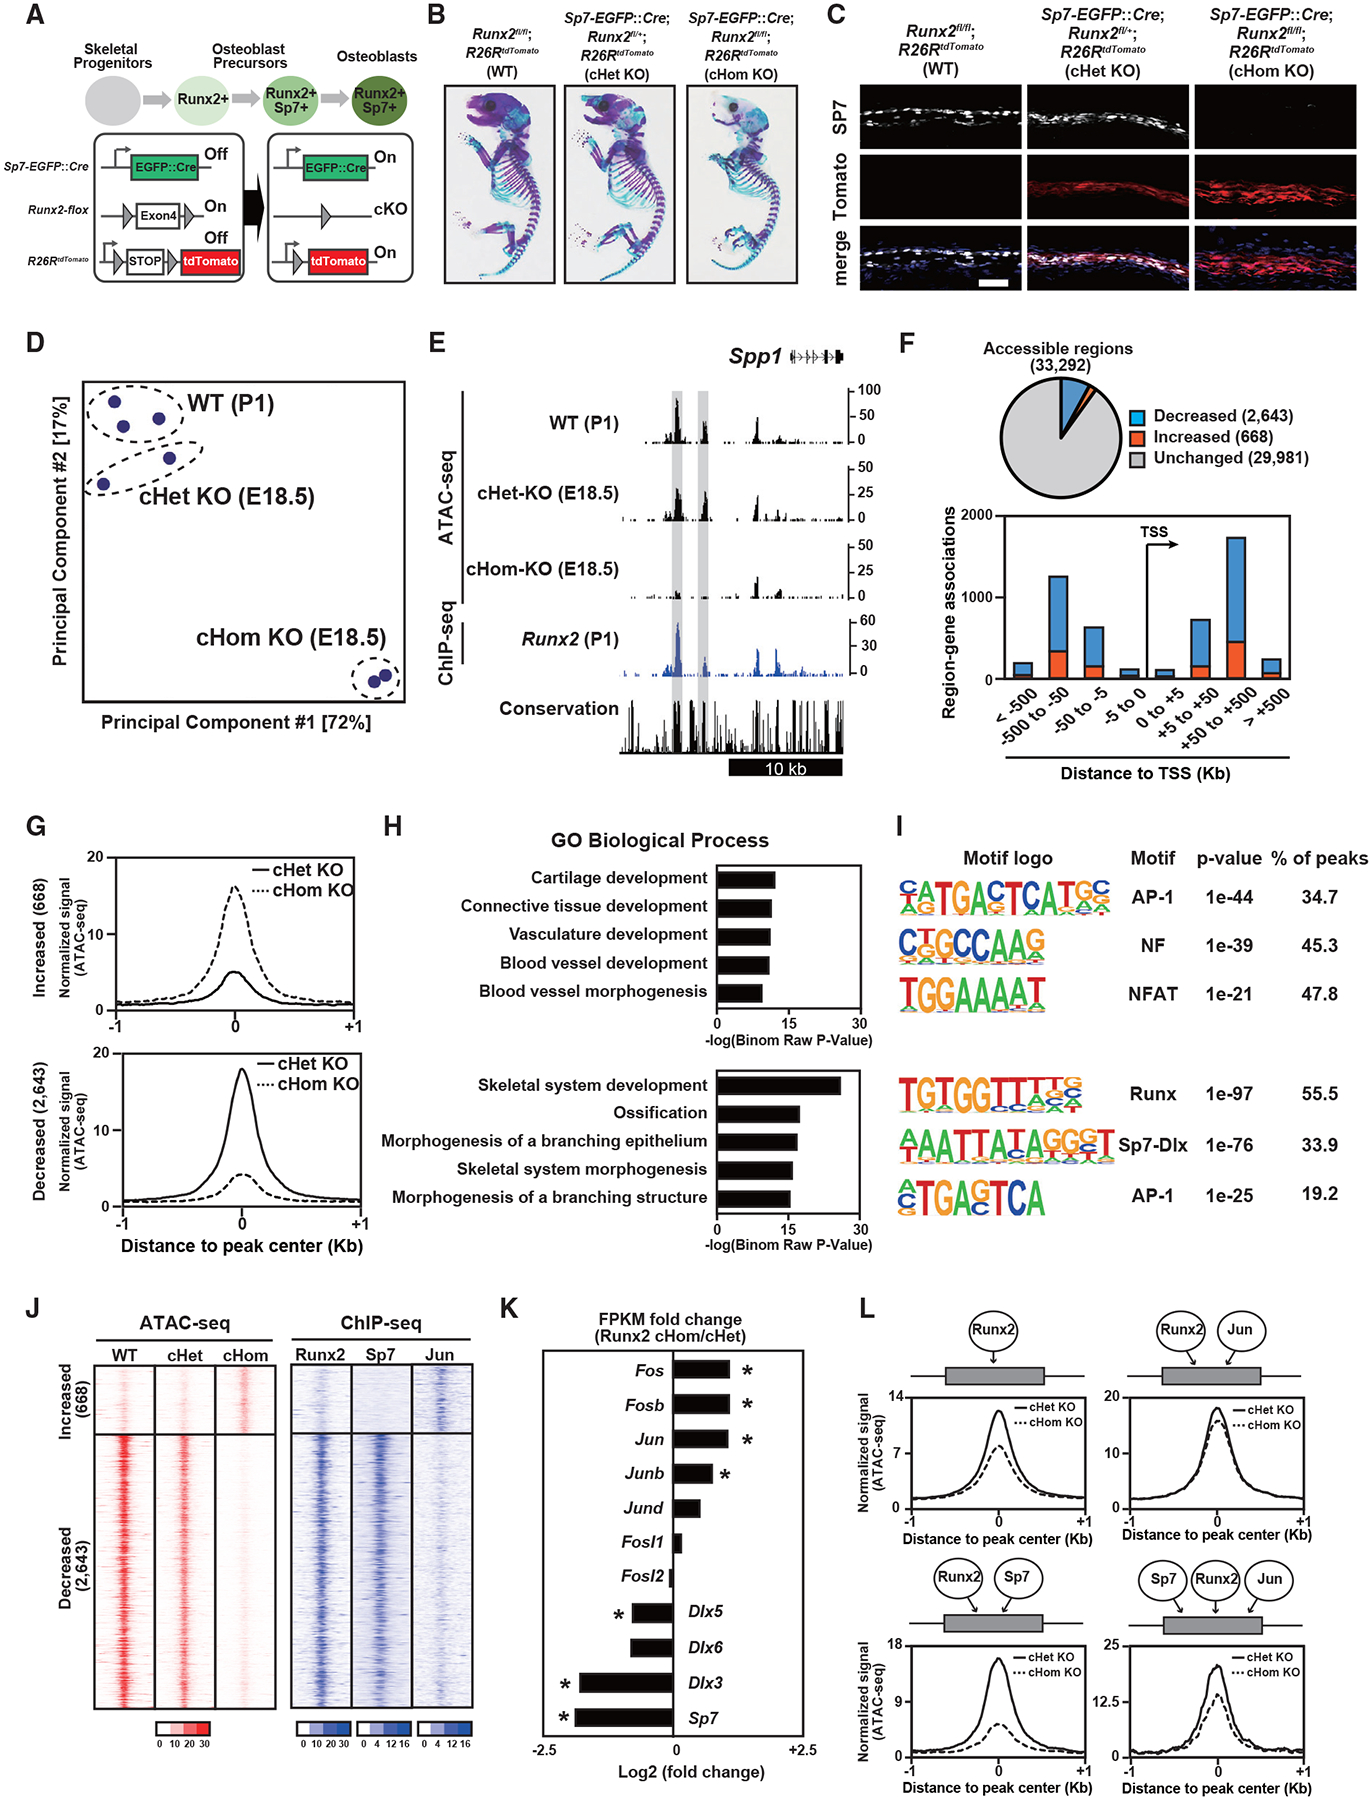
Figure 4. Effects of Runx2 ablation on establishment of Ob chromatin accessibility.

(A) Schematic of Ob differentiation and the genetic strategy.
(B) Whole-mount skeleton of E18.5 pups stained with Alcian blue and alizarin red.
(C and D) Immunohistochemistry for SP7 expression and native tdTomato expression of E18.5 calvariae. Nuclei were stained by DAPI (blue) (C). Scale bar, 100 μm. Also shown (D) is a PCA plot of ATAC-seq. Profiles of biological duplicates and triplicates were plotted.
(E) CisGenome browser screenshot of the flanking region of Spp1 showing chromatin accessibility in calvaria cells of the indicated genotypes and Runx2-DNA binding in Runx2-BioFL calvaria cells. Runx2-dependent chromatin accessible regions are highlighted in gray.
(F) Pie chart showing the change in chromatin accessibility in tdTomato-sorted Runx2 cHomo KO calvaria cells compared with that in Runx2 cHom KO cells (top). Genome-wide distribution of genomic regions shows altered accessibility because of Runx2 ablation (bottom).
(G) Histogram showing the average of normalized ATAC-seq signals in genomic regions with altered accessibility by Runx2 ablation. 668 significantly increased chromatin-accessible regions (top) and 2,643 significantly decreased chromatin-accessible regions (bottom) in Runx2 cHom KO calvaria cells compared with those in Runx2 cHet KO cells are shown. Average values from biological duplicates were used.
(H) GREAT GO annotations of significantly changed chromatin-accessible regions in (G).
(I) De novo motif analysis of the top 500 significantly changed chromatin-accessible regions in (G). The top three most enriched motifs with p value and percentage of peaks are shown.
(J) Heatmap showing the signal intensities of ATAC-seq in E18.5 calvaria cells with the indicated genotypes and those of ChIP-seq for the indicated transcription factors in wild-type (WT) P1 Obs.
(K) Relative gene expression of selected transcription factors in Runx2 cHom KO and cHet KO calvaria cells at E18.5. The values were normalized from biological duplicates. *p < 0.05.
(L) Histogram showing the average of normalized ATAC-seq signals in Runx2 cHet KO and cHom KO calvaria cells at E18.5. The following distal regions were selected based on their associations with transcription factors: regions associated with Runx2 only (top left, 5,180 regions), those associated with Runx2 and Jun (top right, 7,012), those associated with Runx2 and Sp7 (bottom left, 685), and those associated with Runx2, Jun, and Sp7 (bottom right, 83). The values were normalized from biological duplicates.
Representative images obtained from at least biological duplicates are shown (B and C). See also Figure S4 and Table S5.
